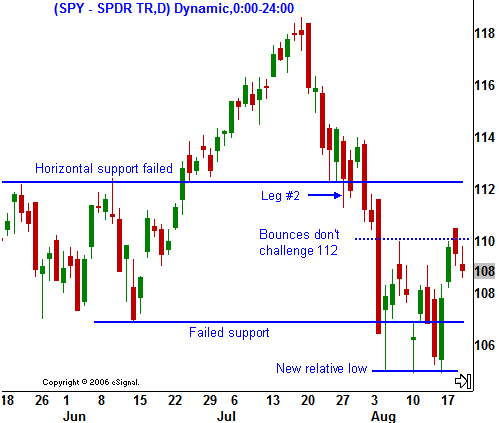
At this stage (Leg #1) I’ve reacted to a market decline that has quickly broken an up trend line and breached horizontal support. I have adjusted my risk by taking profits on my longs and by adding a few long put positions. I have moved from a bullish to a neutral bias and I am waiting to see if the market bounces off of the recent low and resumes the rally or if it makes a new relative low. In the chart, you can see that the lows were breached, marking the beginning of a second leg.
It is always dangerous to act on the first breach, but in the chart you can see that the market has been able to move through the horizontal support level with ease. By the second day there is a close below support and that is a good entry point.
.
.
.
.
Leg #2
1. The game plan is to add to short positions. Buying puts at this level is still efficient since the implied volatilities are elevated, but far from extreme. This move is coming at a market top and the IVs will stay “cheap” until real danger is sensed. By the end of the second leg, the premiums will start spiking. I suggest buying options with 2-3 months of “life”. You don’t know how long the move will last and this will keep you from having to “roll” the positions. You also don’t want to get whipsawed out of a front month put position on one of the snap back bounces.
2. Reduce long positions and take on a decidedly bearish bias.
3. Look for the next support level and watch how the market reacts to that level.
4. If the market is able to establish a new relative low, and the bounces bring it back to the upper end of the range with ease, it means there is a strong bid to the market and you should take profits. By all means, if the market breaks above the horizontal level that started the second leg, get out of your bearish positions and get back to a neutral bias. There may not be a third leg and with the market volatility, cash is king until you can get a better read.
5. If the market is spending more and more time at the lower end of the range, I prepare for a third leg. I want to see lower relative highs and I want the support to be tested with frequency. This tells me that every time the bulls try to rally the market, the sellers are more anxious and they start selling earlier.
In the chart, you can see the long red candle that takes out another support level. You can also see that the next day there was a big washout (long candle wick) and a snap back rally. The low end of the wick represents a new relative low. You can also see that the subsequent rally marks a relative high within the range. It is far from the SPY 112 level and this is a bearish sign since the sellers are eager to unload shares before that level is challenged. Over the next few days, the SPY 105 level is tested with greater frequency. If that level is breached, it will signify the start of the third leg.
The next article will describe how to identify the third leg and how to devise an option trading strategy for it.
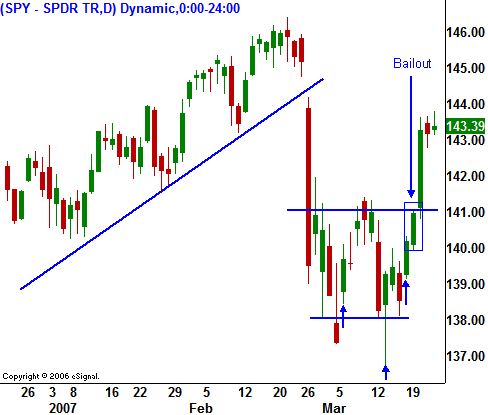
As I wrote this article (March 23rd), it became clear that the recent market decline on February 27th was a head fake. I followed my routine and established bearish positions in anticipation of a second leg when new relative lows were made. I was early and I warned readers on Tuesday and Wednesday to exit short positions. I cleared out my shorts (for a loss) and I got back to a neutral bias before the big move up. The give away was the big snap back rallies (blue arrows) that we saw off of each of the lows and the fact that the market was able to easily get back to SPY 141. The other clue was the bear’s inability to string 2 or 3 days of selling together.
.
.
.
.


