Still More Bearish Than Bullish – Watch For These Patterns
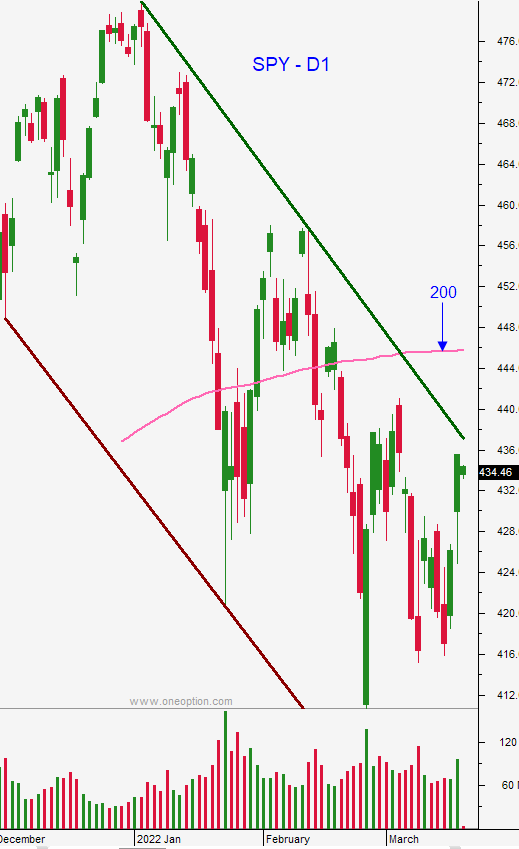
Posted 9:30 AM ET – The S&P 500 rallied when the Fed only raised rates by 25 basis points and follow through buying fueled it through the downward sloping trendline on a daily chart. The Quadruple witching “goosed” the move, but the 200-day MA should provide resistance. The S&P 500 is down 30 points overnight.
The Fed is hawkish and it sees 25 basis point rate hikes at each of the meetings the rest of the year (1.75%) and 3 rate hikes next year. The first rate hike will not have much of an economic impact because interest rates are still near historic lows. Each subsequent rate hike will have a more meaningful impact and Asset Managers will still remain cautious for the next few months. The Fed lowered its GDP forecast to 2.8% for the year (from 4%) and they raised their expectations for inflation.
China’s “lip service” provided a nice short covering bounce. They promised to ease up on tech regulations and to consider more accounting transparency to avoid delisting. They also said they will support financial markets (property developers). As I eluded, there is no substance to these claims. I view the bounce as just that and these stocks will soon run out of steam. Set downside alerts. These will be good shorts when this bounce runs out of steam.
Swing traders should remain in cash. I believe our market bounce is temporary. There is not one Asset Manager that believes that this will be the last chance they have to buy stocks at this level. The SPY has spent a month below the 200-day MA and that is a sign of selling pressure. Aggressive swing traders can consider selling bearish call spreads on weak stocks as long as the SPY stays below the downward sloping D1 trend line. The 200-day MA is just above it and it will also provide resistance. Don’t go overboard. The weekly chart of the SPY is still very bullish and we want to tread cautiously. These should be neutral to slightly bearish trades and you should be selling the call spreads above technical resistance. If that resistance is breached you need to stop the trade out.
Day traders should watch for these patterns. The first is a gap and go down (20%). If you see stacked red candles consecutively with little to no overlap get short. This would be very bearish and it would be a sign that the down trendline breakout on D1 yesterday was a giant head fake. Bullish speculators will be flushed out and the move could gain momentum. After heavy buying this week, the market is not just going to roll over and I am not likely to trade that move because I don’t want to chase. A more likely scenario (30%) is a weak bounce. Look for mixed green and red candles with overlap. If the bounce stalls in the middle of the gap the next bearish cross will be a good one. The bounce will allow us to see which stocks are still at the low of the day (relative weakness) and we will be able to short them on the first bearish cross. The 1OP indicator is starting the day off in a hole so it is best to see what buyers are able to do during the bullish cycle. A gap fill is possible (20%) given the buying we saw the last few days, but the 200-day MA will provide resistance next week. I would focus on beaten down tech stocks if this unfolds (day trading only). The final scenario is a gap down and a gradual wimpy decline with mixed candles (30%). This would provide us with an opportunity to short some of the laggards that have bounced recently, but the better trade will come once support has been established. At some point buyers will try to make another run and this could set us up with some nice call lottos. It is quadruple witching so if momentum can gain traction either way it should continue.
In general, I see the buying this week as a relief rally. The breakout in all likelihood was a head fake. The Fed is hawkish and the issues plaguing the market are still there. I am still fairly bearish. The next drop is more likely to find support at a higher low and then we could get a nice rally as earnings season gets closer.
Support is at $425 and $437. Resistance is at $441 and the 200-day MA.
.
.
Daily Bulletin Continues...