Option Stalker Pro Manual
Introduction
Welcome to the Option Stalker Pro manual. Option Stalker Pro (OSP) is a full feature trading platform specifically designed to trade Relative Strength & Weakness. It is fully integrated with Interactive Brokers, Charles Schwab (soon!), and Tradier brokerages to provide full consolidated tape for real-time data, order entry and position management. We look forward to walking you through its features.
For additional information about how to use the platform and trade Relative Strength & Weakness, please visit our tutorials.
Account Dashboard > Option Stalker Pro Download
Table Of Contents
- Installation & Setup
- Workspace
- Charts
- Lists
- Scanner
- Custom Search
- Alerts
- Push Notifications
- Custom Alerts
- Trade Entry
- Main Chart Tabs
- Market View
- Sector Analysis
- Daily Bulletins
- Tutorials
- Support
Installation & Setup
Option Stalker Pro is built for Windows machines. To use it on a Mac, please use Parallels or Bootcamp.
System Requirements
- Windows 7 or higher
- .NET Framework 4.7.2 or 4.8
- Screen 1280 pixels wide or larger
Installation Instructions
- Download Installer – Click the ‘Download Pro’ button in your Account Dashboard to initiate the download.
- Run Installer – When your download is complete, initiate the installer by
Double-Clickingthe .exe file in your computer’s Downloads folder. - Follow Setup Wizard – Follow the prompts in the Installer Setup Wizard. When finished, Option Stalker Pro will be successfully installed on your machine.
- Link Brokerage – Option Stalker Pro requires a link to your brokerage for the highest quality real-time data. Follow the steps below for brokerage-specific instructions. Without a broker linked, OSP can run with the Intrinio data option selected. This comprises about 10% of market volume.
Charles Schwab & Tradier
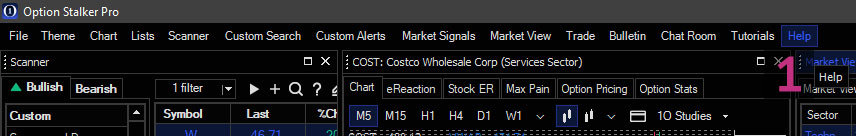
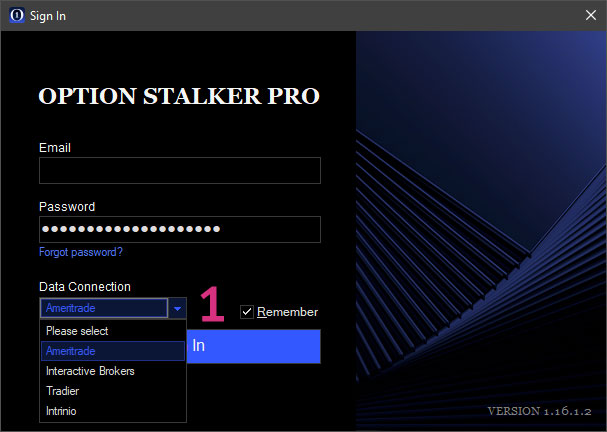
Charles Schwab and Tradier Brokerage are easy to integrate. In the Option Stalker Pro sign-in window, select the appropriate broker in the dropdown menu.1 During sign-in you will be forwarded to their website to provide your sign-in credentials and establish the connection.
Interactive Brokers
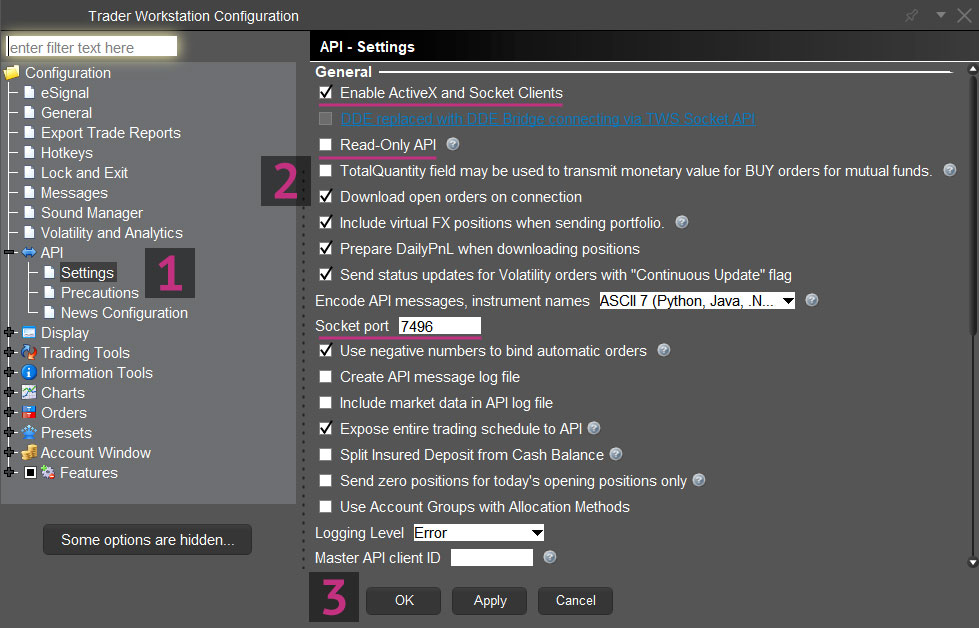
Interactive Brokers requires a small settings configuration in their trading platform Trader Work Station (TWS). Open TWS and find File (or Edit in some versions) in the upper-left corner. Follow the path: File>Global Configuration>API>Settings.1 Once there, mark the first box: Enable ActiveX, confirm that Read‑Only API is NOT selected and set Socket Port to 7496.2 Click OK to apply the changes.3 This setup procedure only needs to be done once. Always sign into TWS before launching Option Stalker Pro. Then, select Interactive Brokers in the Option Stalker Pro sign-in drop down menu. During sign-in OS Pro will automatically connect to TWS.
If you’re experiencing any problems with your Brokerage Setup, please read Brokerage APIs for more information.
Workspace
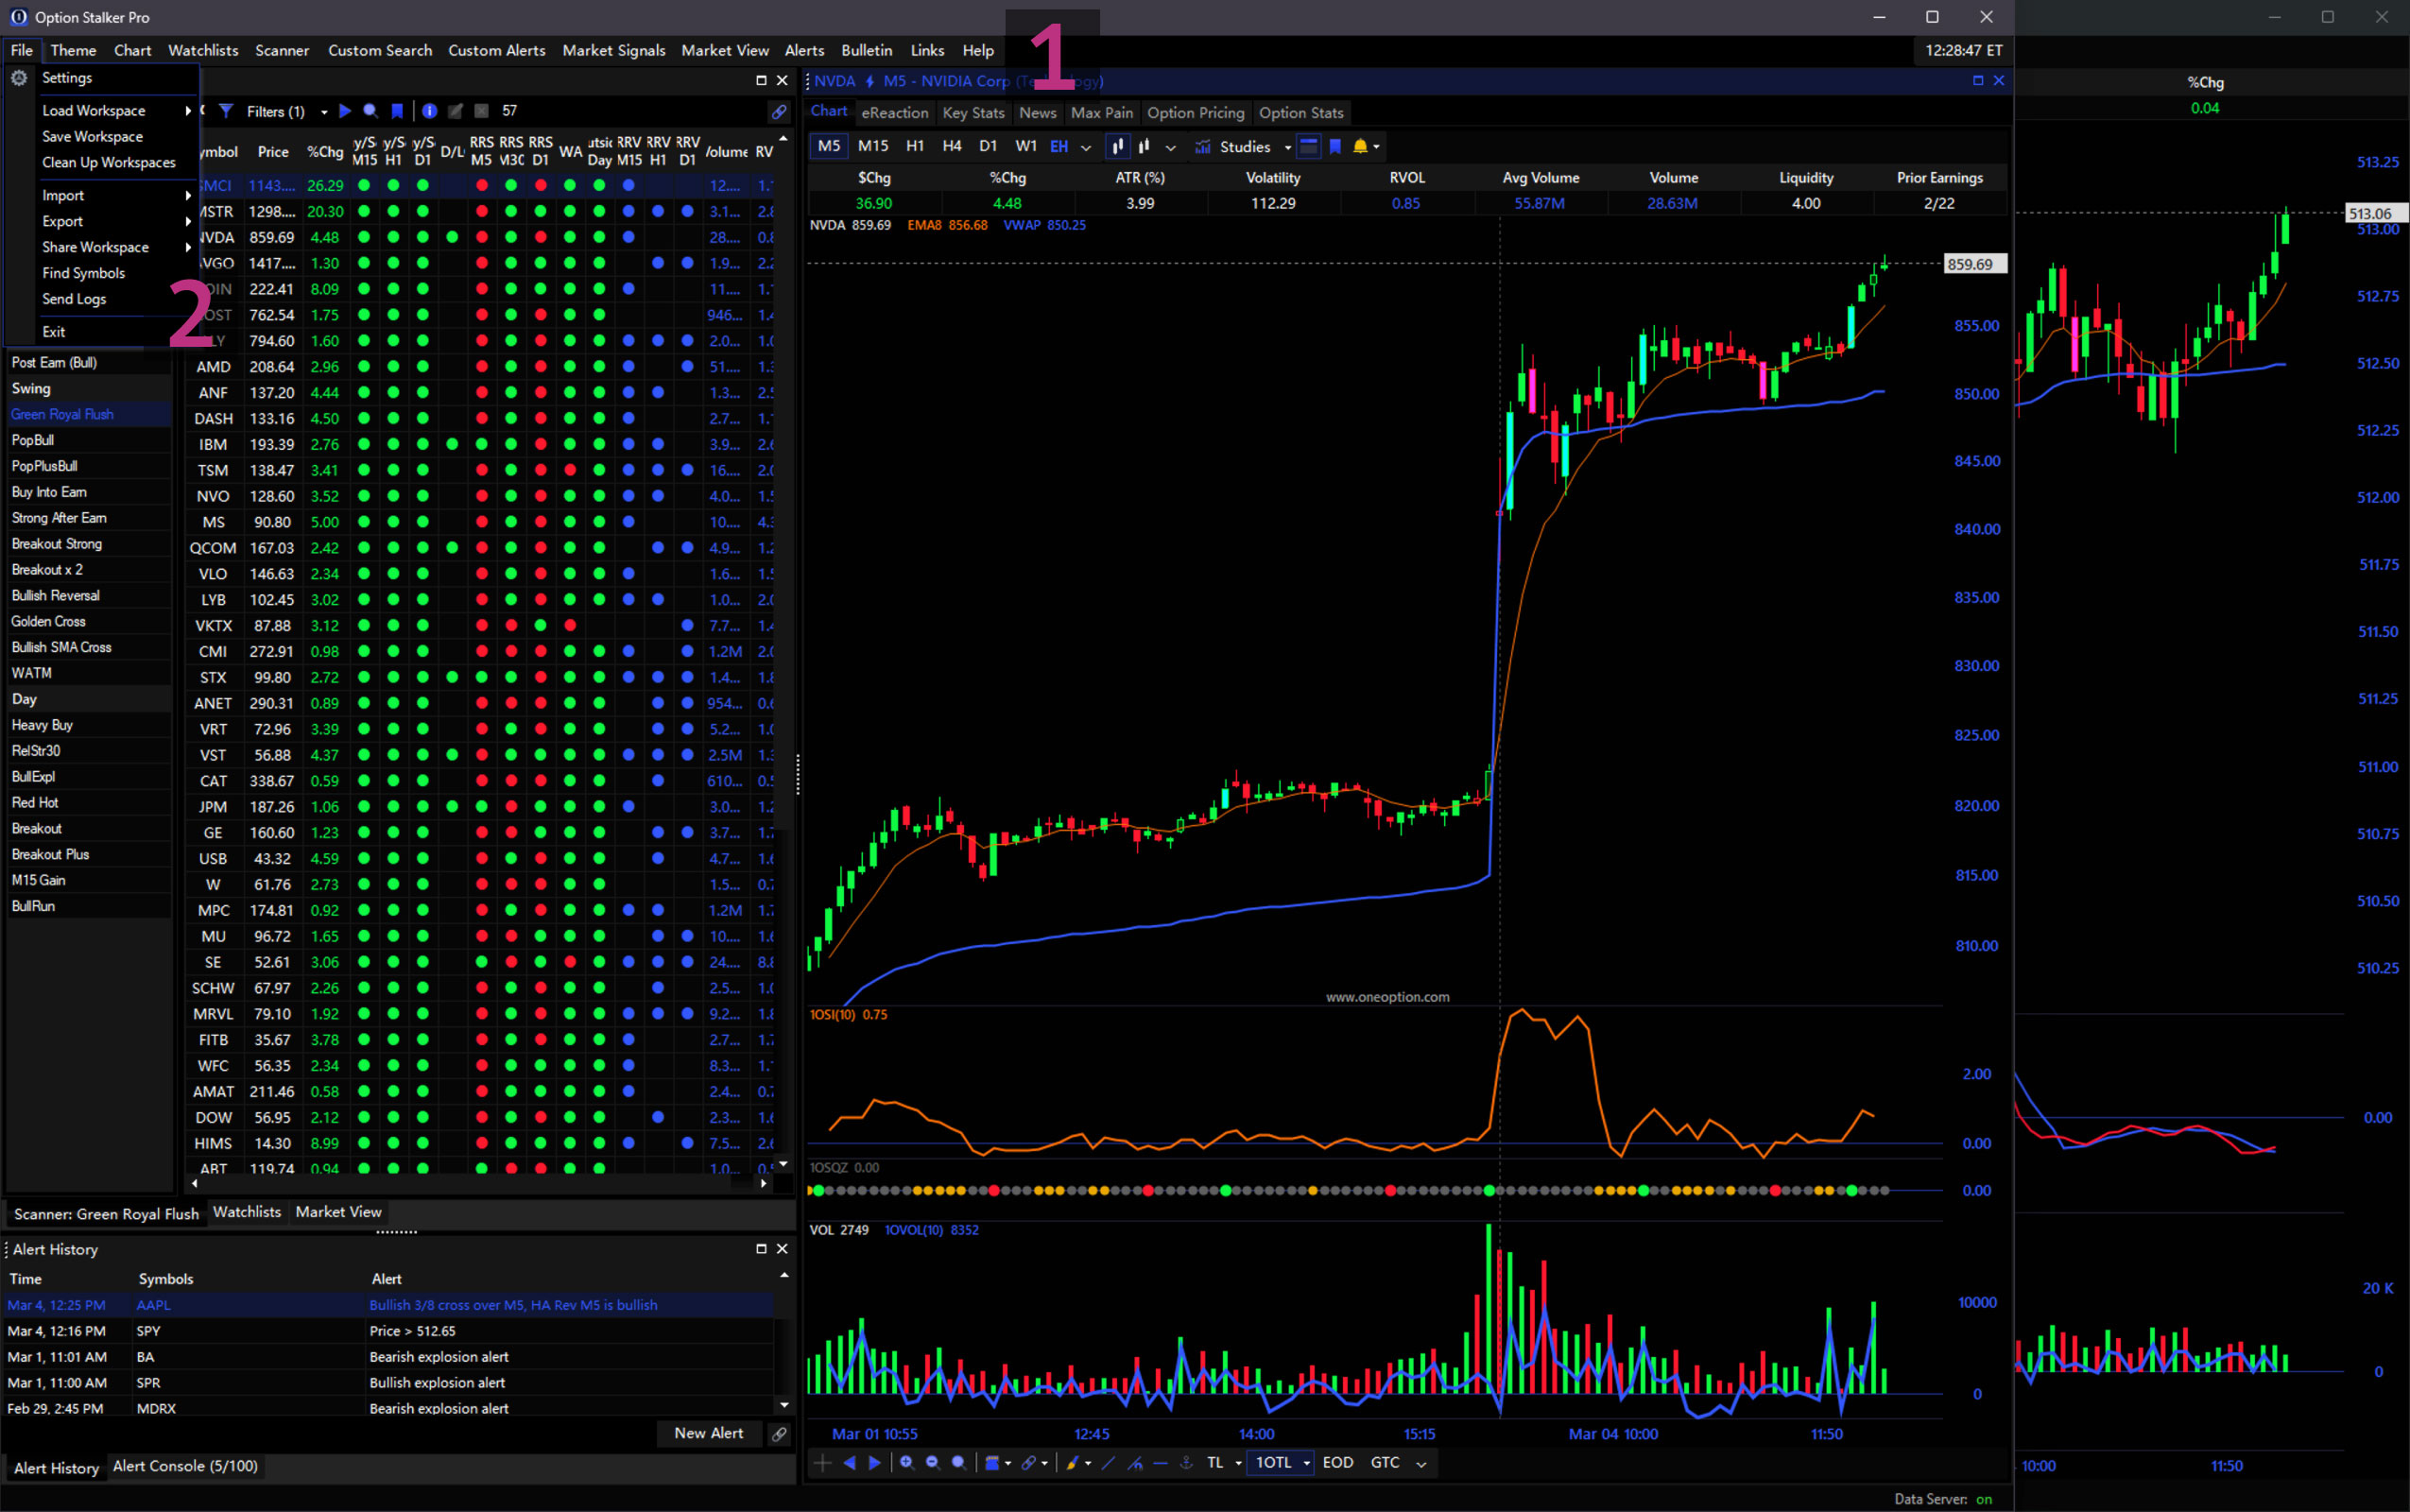
The Workspace consists of all OSP elements, including the main window, its enclosing panels and any additional popup windows. The main window contains the Main Menu.1 You can save and load your Workspace from File in the Main Menu.2 By default, OSP will auto-load your Workspace at launch.
Panels
When first opening OSP, the main window will include three panels: Scanner, Watchlist and Main Chart. Panels are modular units that organize the OSP workspace. They align with and nest within each other when repositioned. To reposition a panel, drag it by its header. While dragging, icons appear to indicate possible panel positions. Panels can be placed side-by-side or as tabs.
Panel Linking
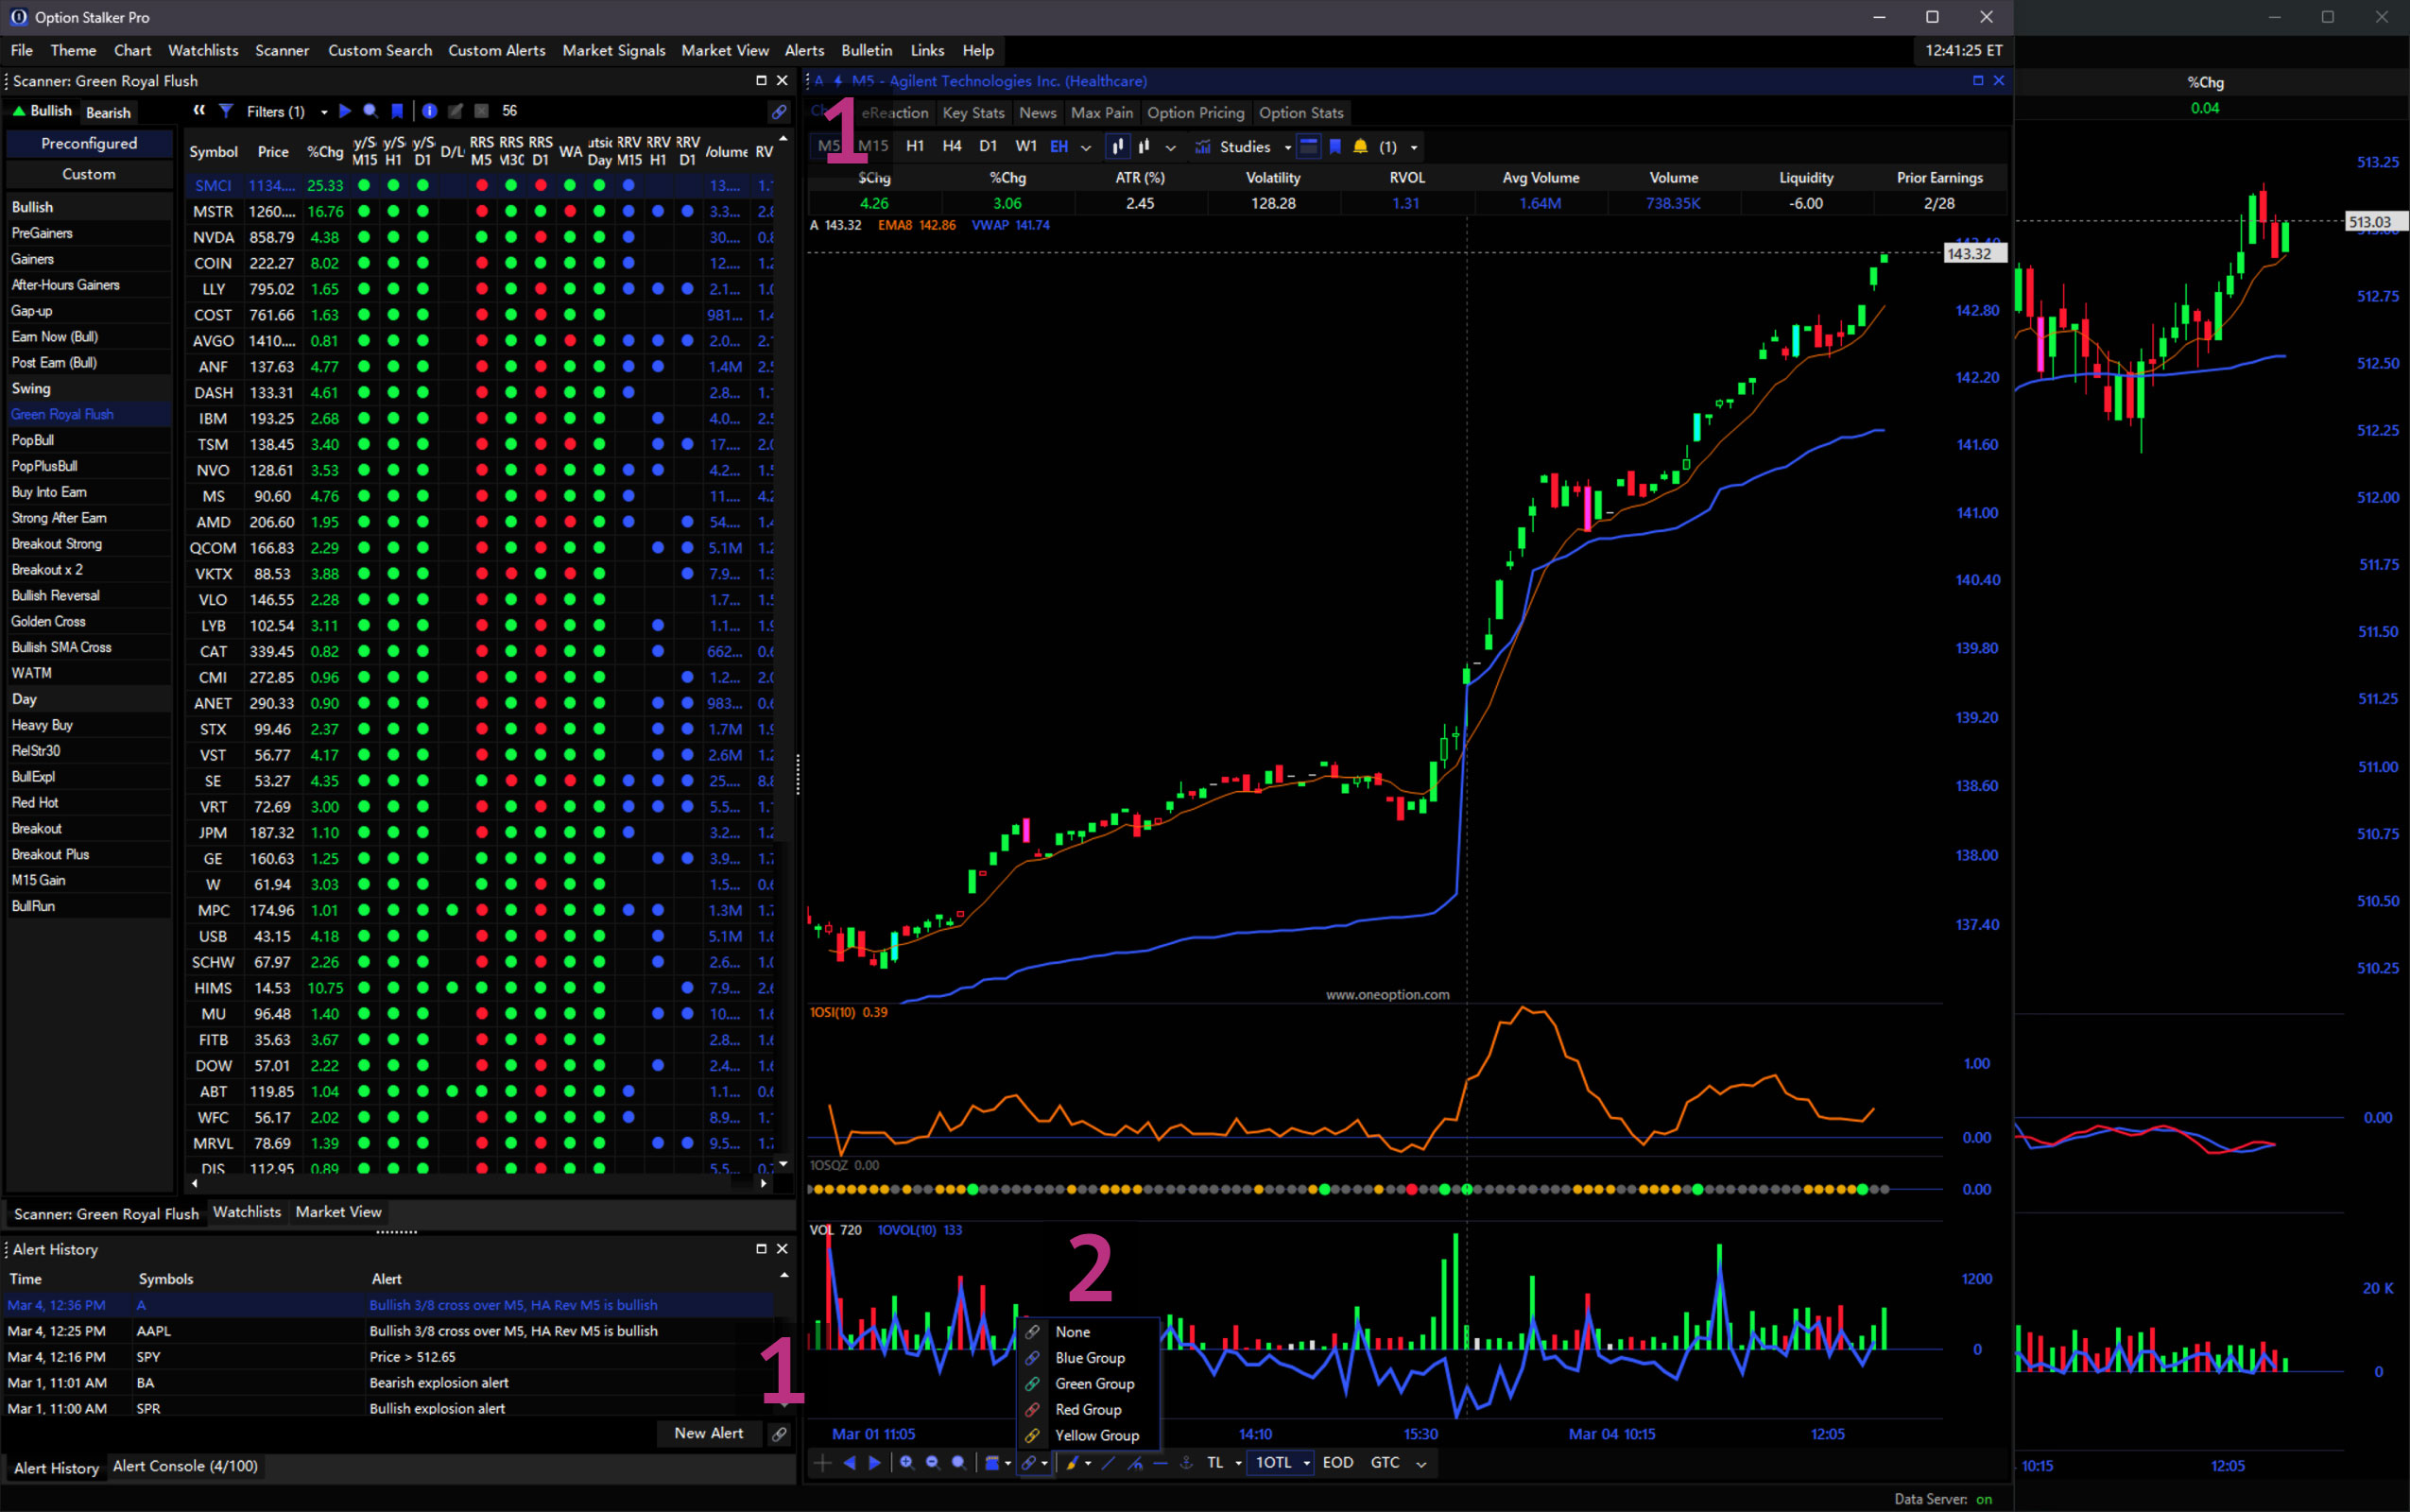
Panels can be linked to display information for same symbol with Link Groups.1 Use the Link dropdown to set a Link Group color.2 Panels with the same link color will synchronize symbols. If, for example, you set your Scanner panel to blue and a Chart panel to blue, any symbol clicked in the Scanner panel will cause the chart to change to that symbol. Link Group settings save with your Workspace.
Note: Your workspace settings are saved in “C:\Users\yourName\AppData\Roaming\Option Stalker Pro\your@email.com” (AppData is a hidden folder and needs to be revealed). These files can be copied to run OSP with an identical setup on multiple computers. You can also delete these files to reset your workspace layout for troubleshooting.
Charts
Charts are optimized to trade Relative Strength & Weakness and cleanly designed for efficient extended use. Use the Chart button in the Main Menu to create a new chart popup window or panel (that can be nested in the workspace layout). To change the selected stock, type A-Z while a chart is selected and hit Enter/Return. Type 0-9 on a chart to update the timeframe/interval.2 The timeframe can also be changed with the timeframe toolbar.3 Use the chart style toolbar to adjust the chart type. By default, Candlestick and Heikin Ashi chart styles are visible for quick access.4 Click the dropdown arrow to adjust which buttons are visible. These settings save with your Workspace.
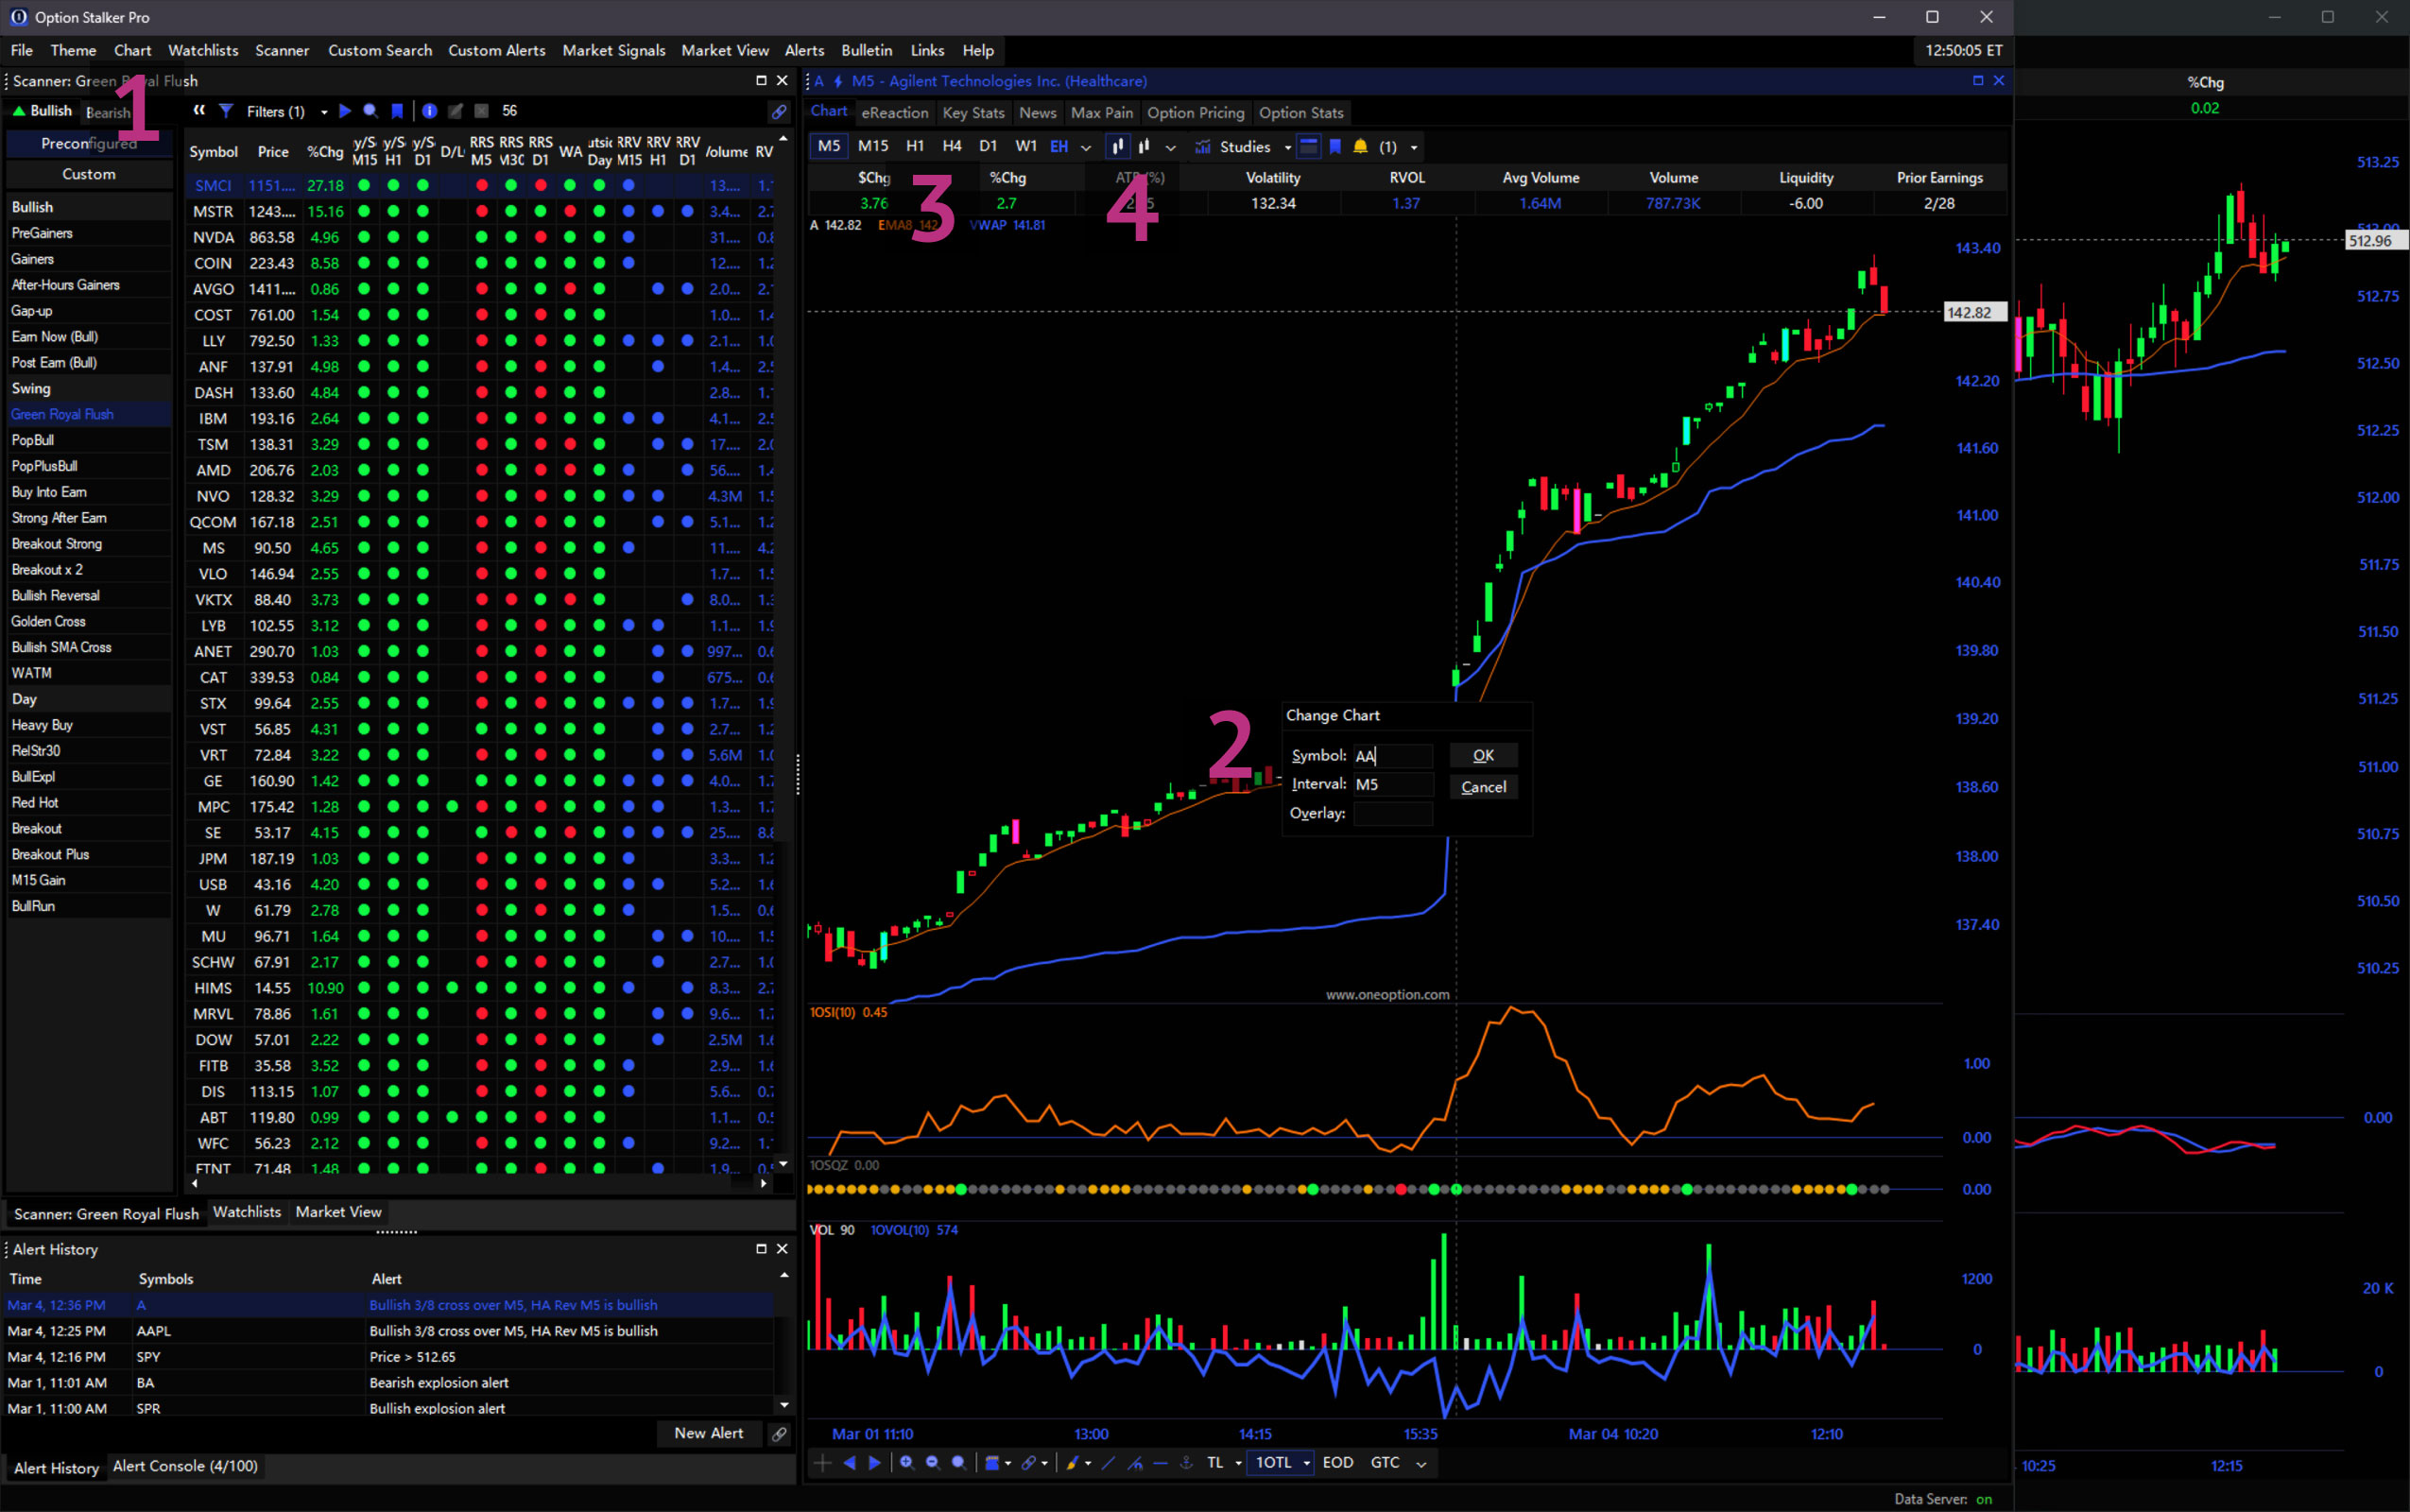
Chart Navigation
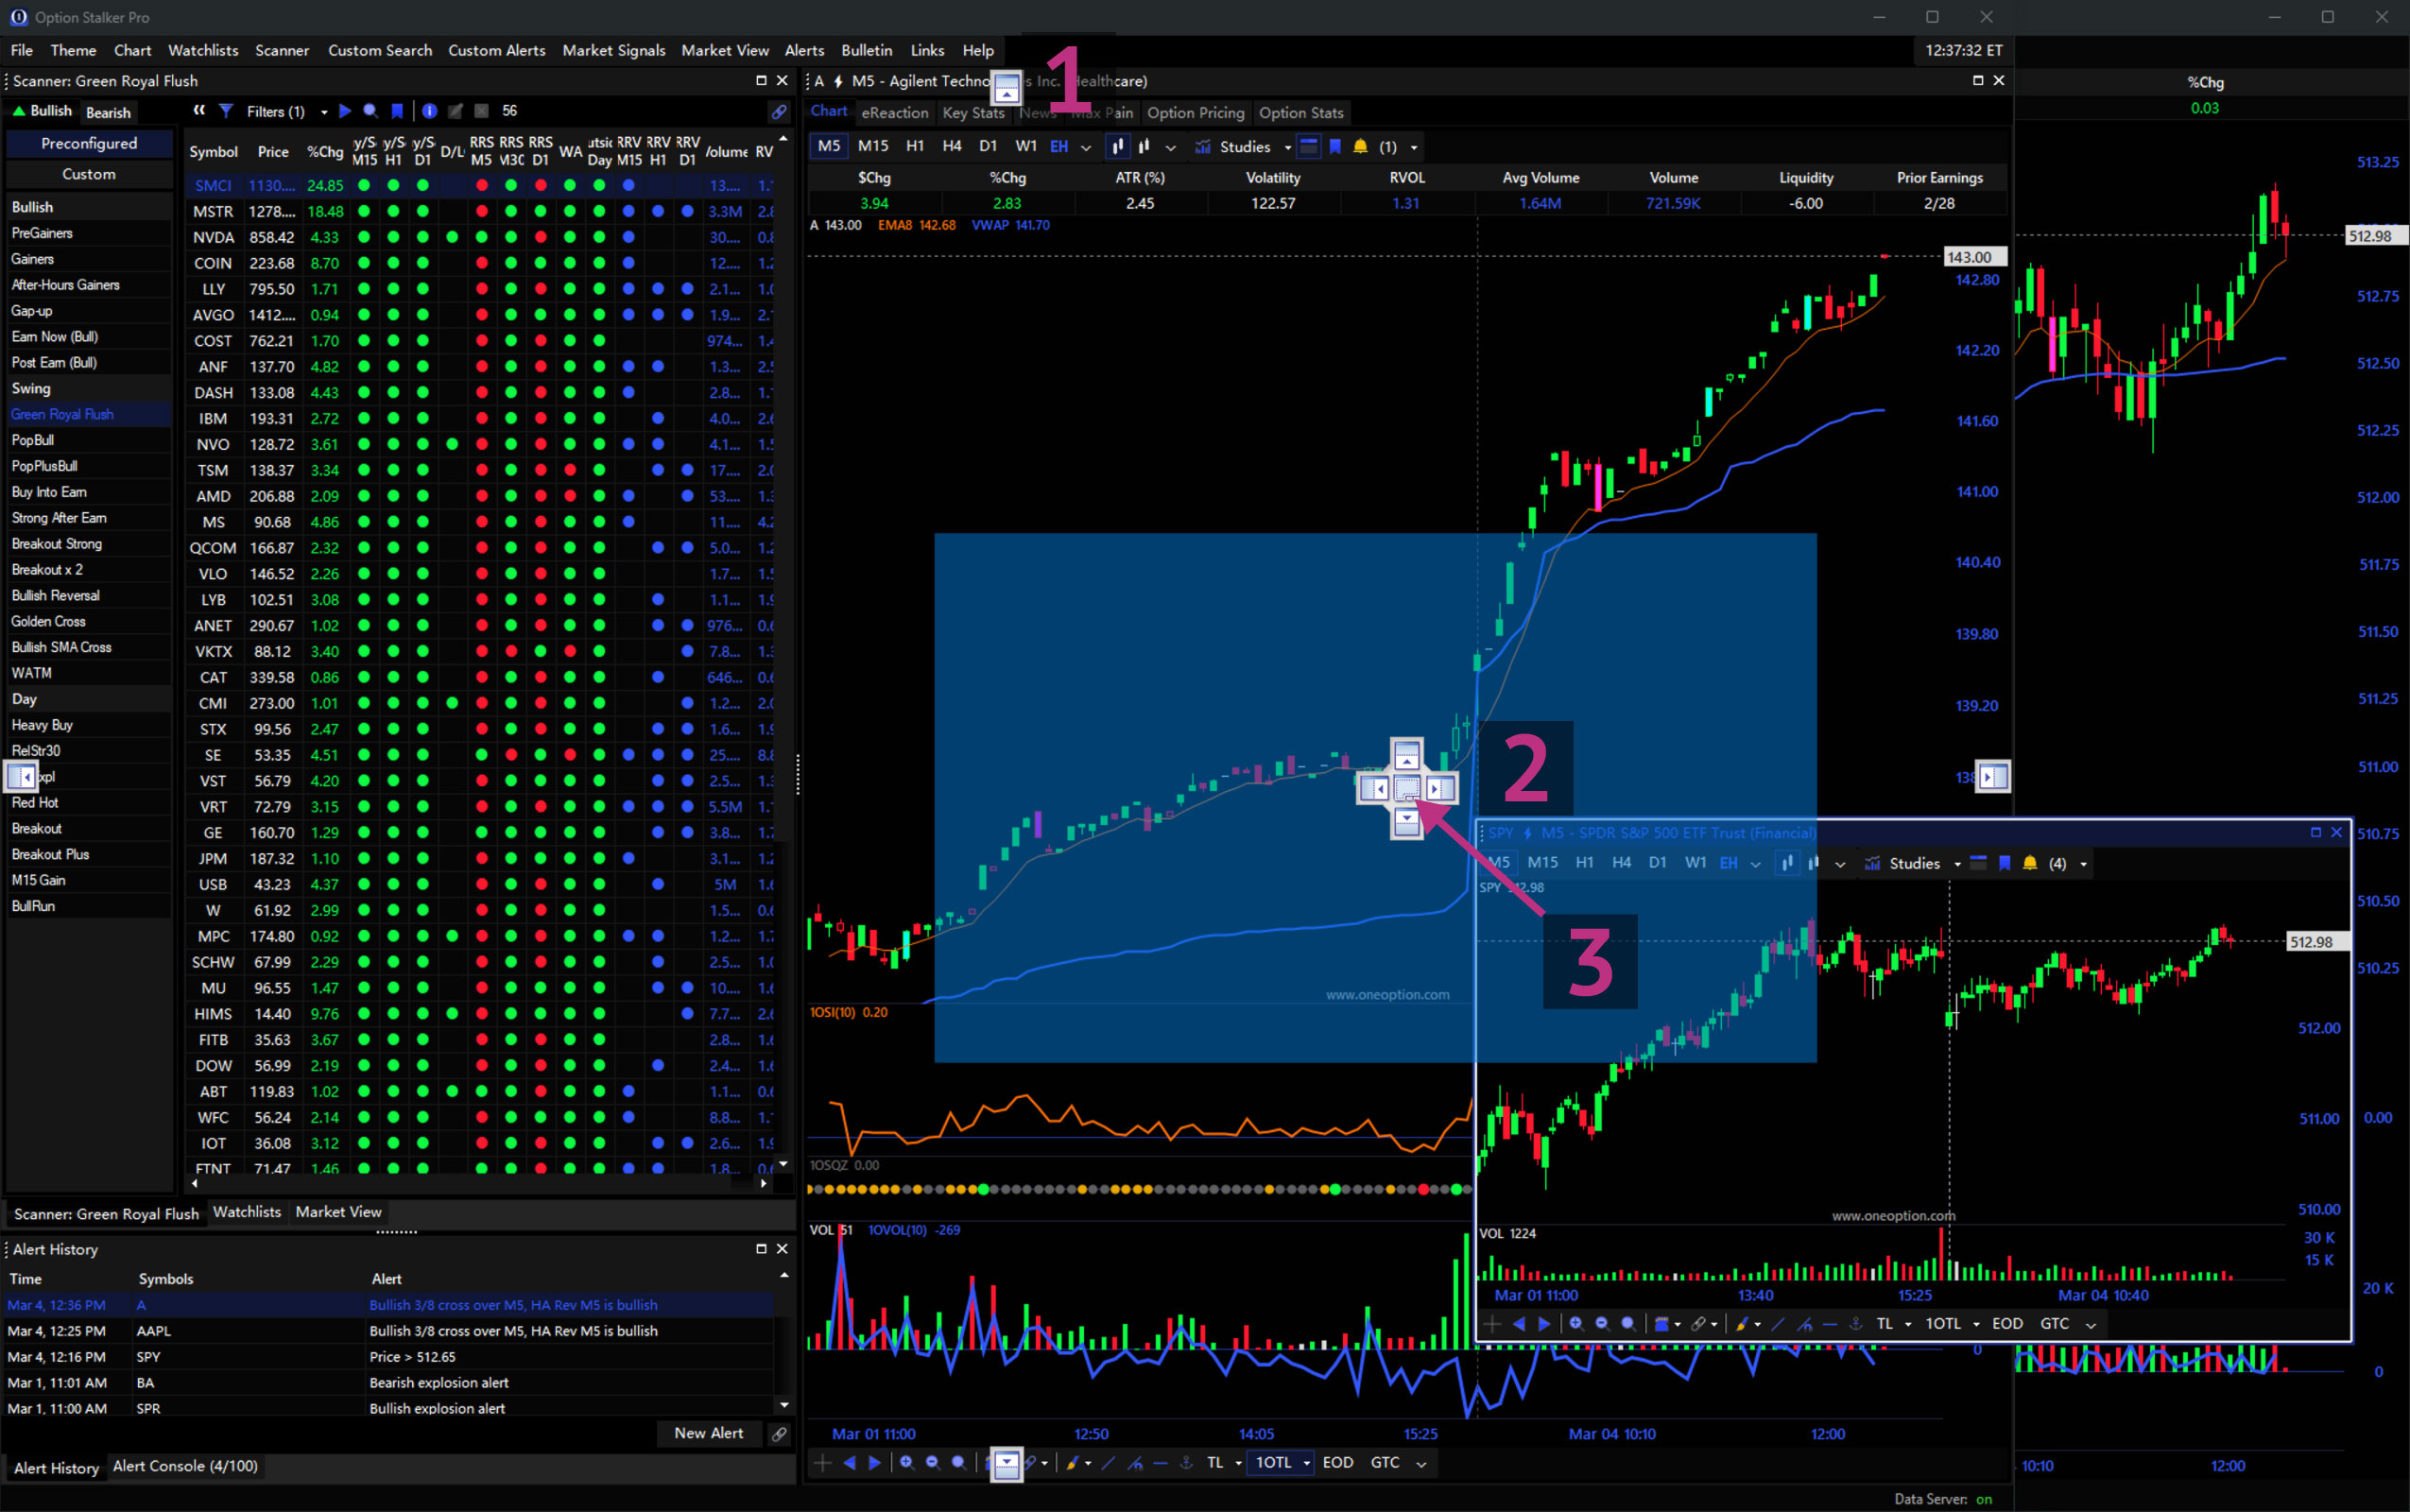
Basic chart navigation is performed using the toolbar area in the lower-left. Scroll back and forth on the chart using the Left and Right arrows or by dragging the chart.1 To zoom in on the chart, click the Magnifying Glass with a plus (+) sign2, Shift+Click on the chart to define the zoom area (in blue)3, or use your mouse scroll-wheel. To zoom out, use the Magnifying Glass with a minus (-) sign, Ctrl+Click the chart or use your mouse scroll-wheel. Click the third Magnifying Glass to reset zoom to default. Chart zoom can also be adjusted by dragging the chart x-axis.4 To expand or compress the chart vertically, drag the chart y-axis.5 Along with the Left and Right arrows, you can go back in time by clicking Home on your keyboard. If you want to get to the current day, hit End.
For additional chart navigation methods, please refer to the Chart Keyboard Shortcuts below.
Chart Indicators
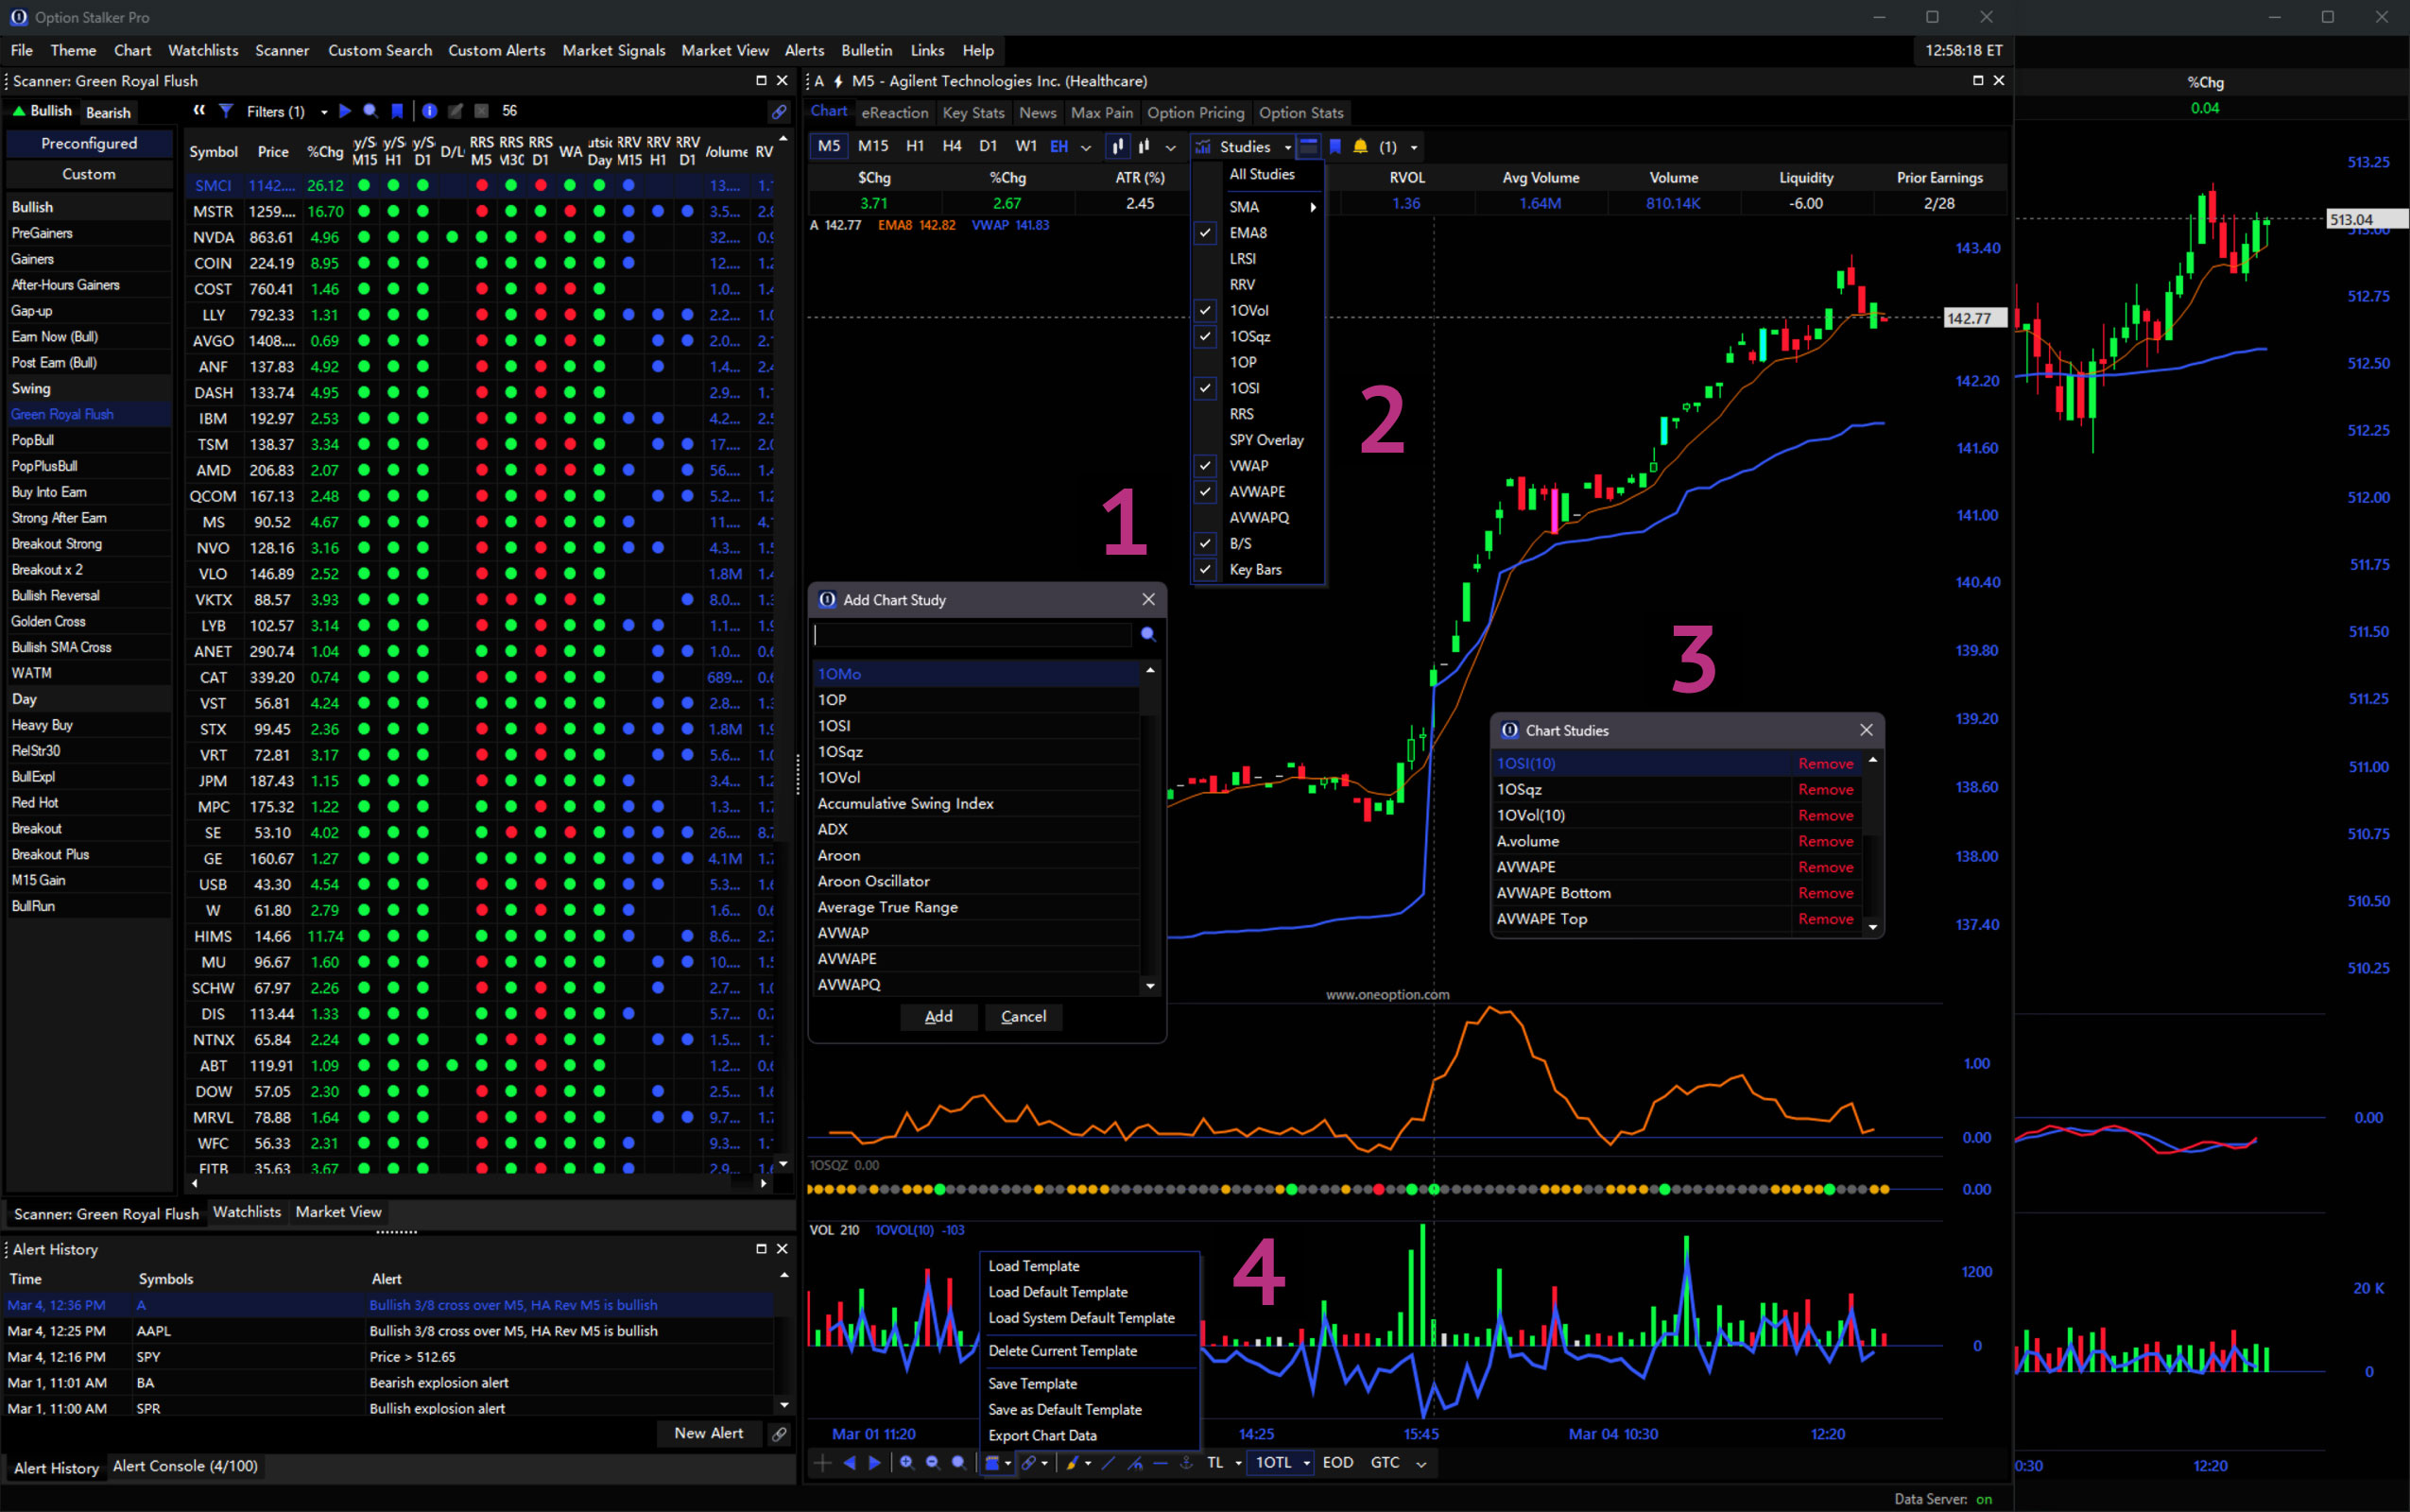
Chart studies/indicators can be added using the All Studies and 1O Studies buttons.1 The 1O Studies dropdown contains important indicators for trading Relative Strength & Weakness, including proprietary OneOption indicators.2 Right-Click the chart area and click Remove Studies to remove applied studies.3 Use the Save button to save and load chart study configurations (templates).4
Automated Trendlines – 1OTL
By back-engineering decades of experience, we have created an additional auto trendline system we call 1OTL. Special rules are used to auto-drawn trendlines in OSP in close accordance with the ‘Algo Lines’ discussed in /r/RealDayTrading to save traders time by vastly reducing the amount of trendlines required to manually draw. To use this feature, simply toggle between 1OTL Now and 1OTL Past at the bottom of the chart.1 Automated trendlines are applied to Daily Charts.2 Read Pete’s article in The System, Automated Trendlines, for more information.
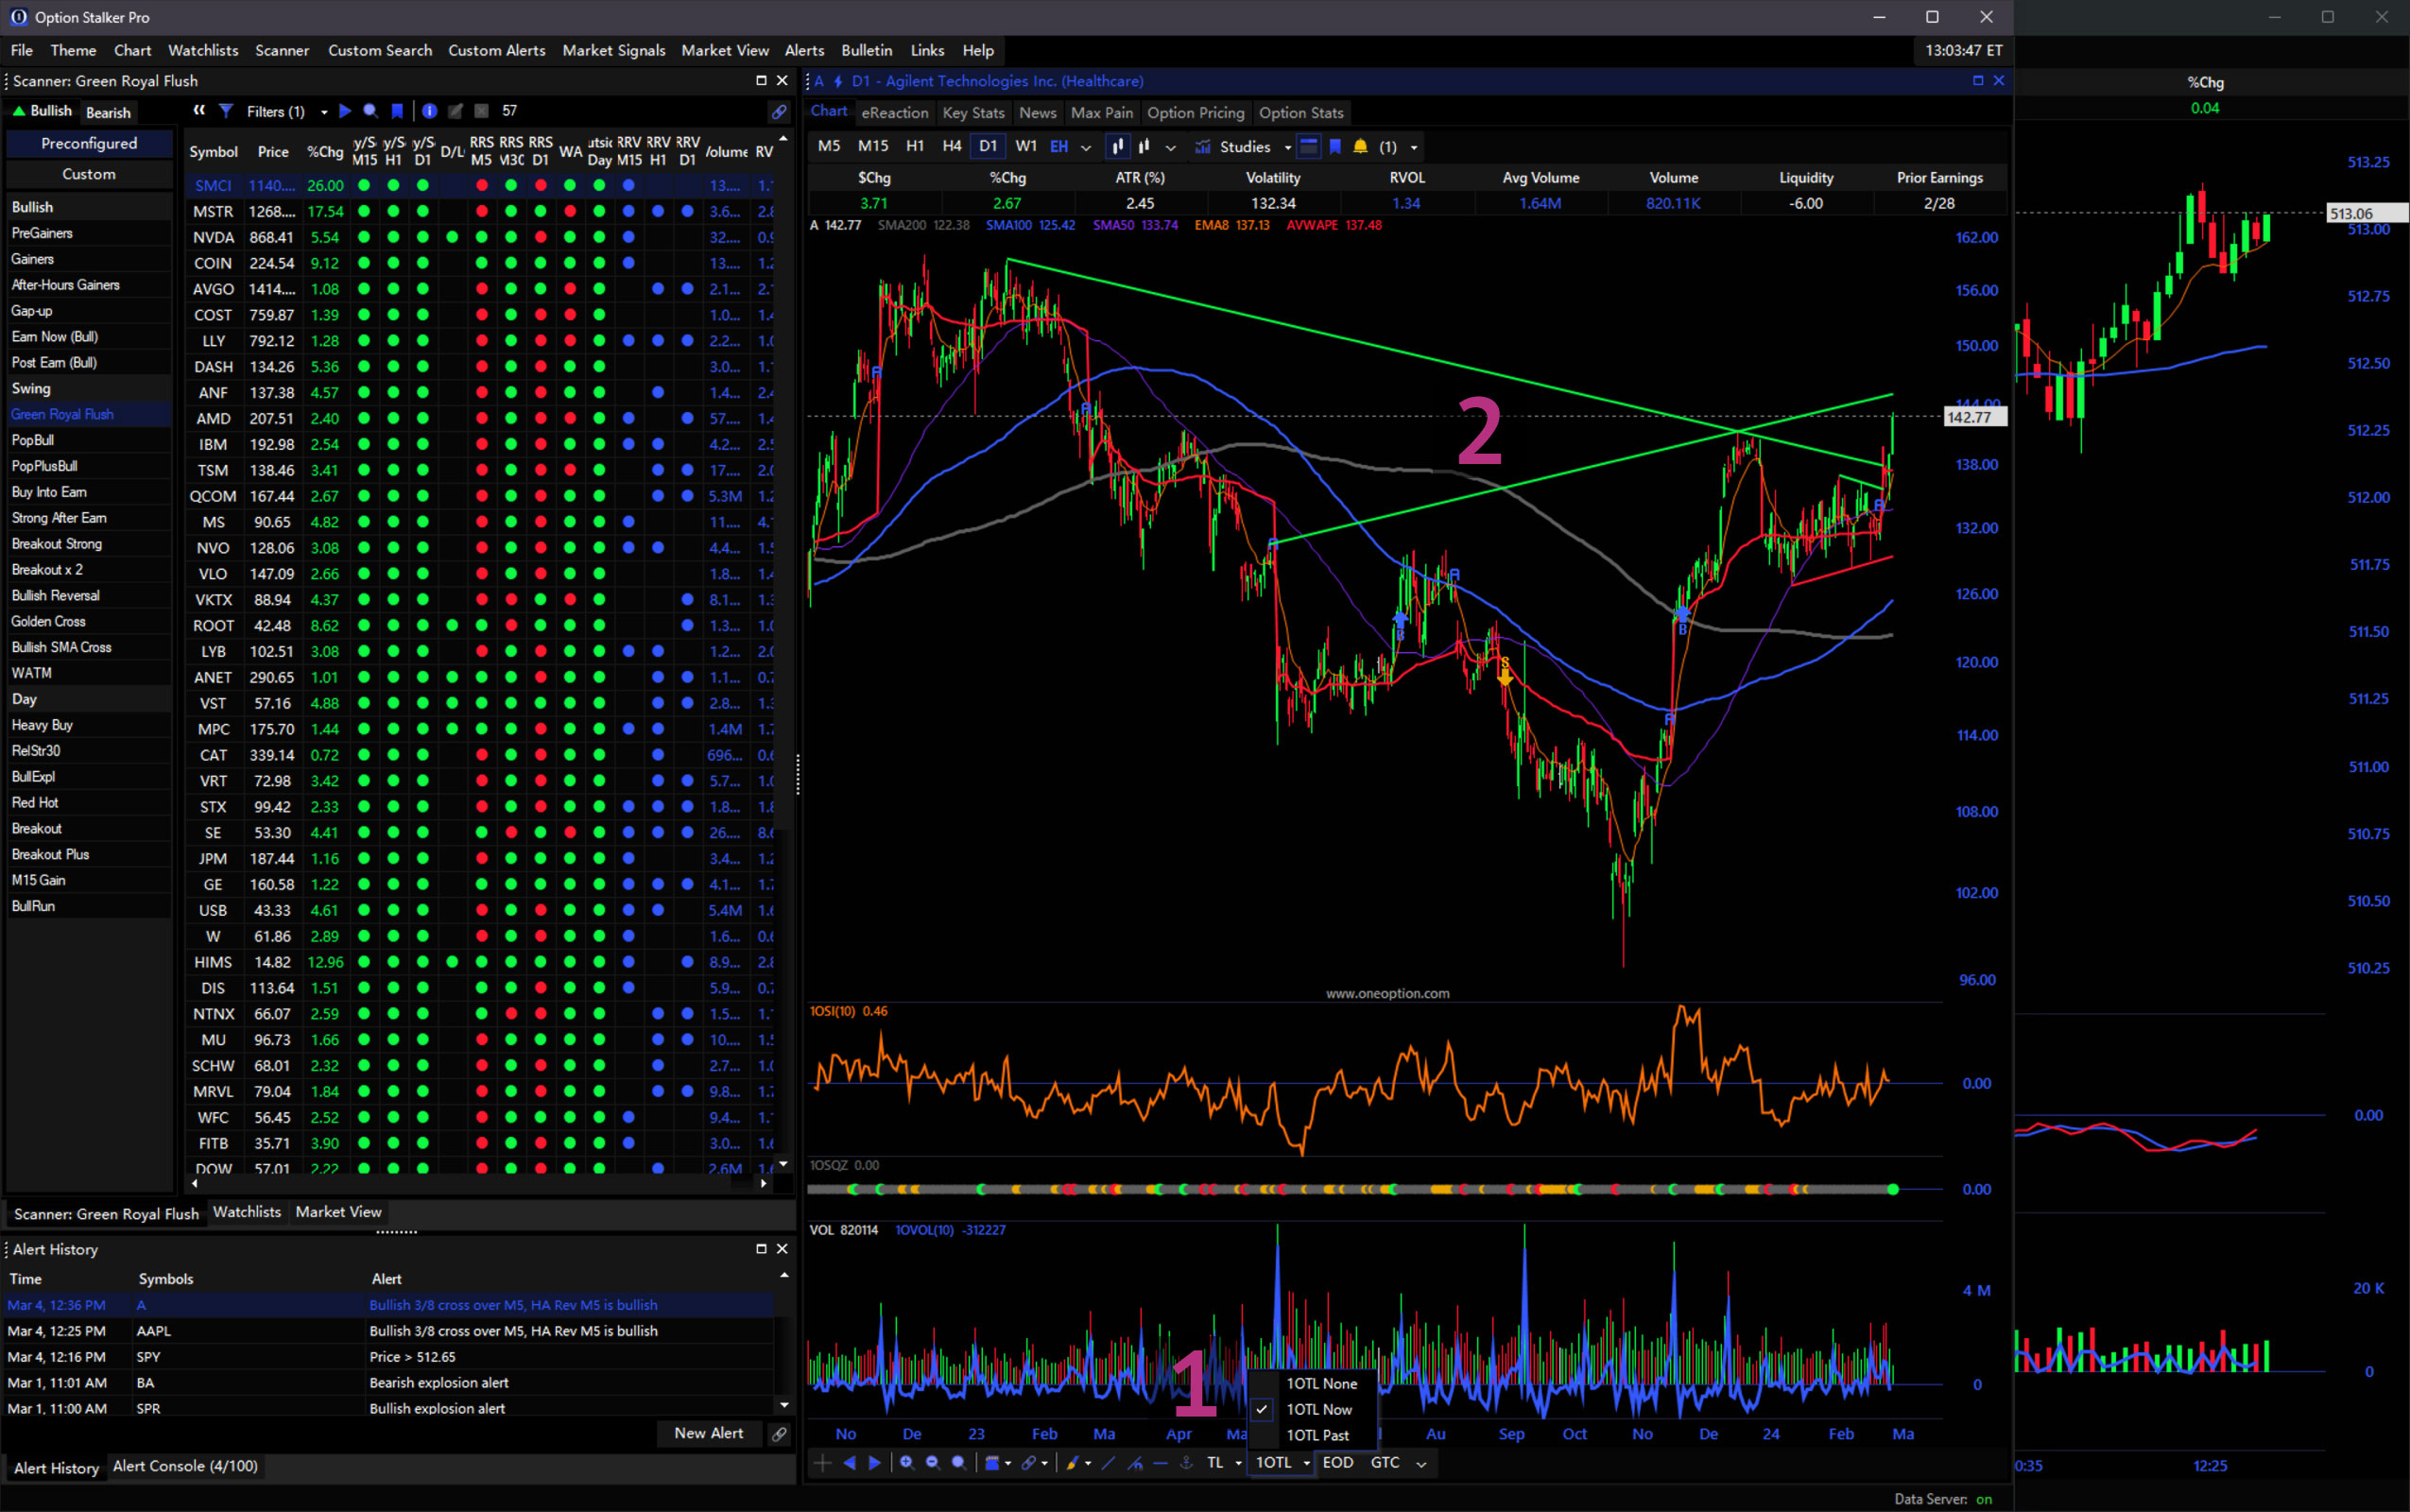
Chart Trendline Alerts
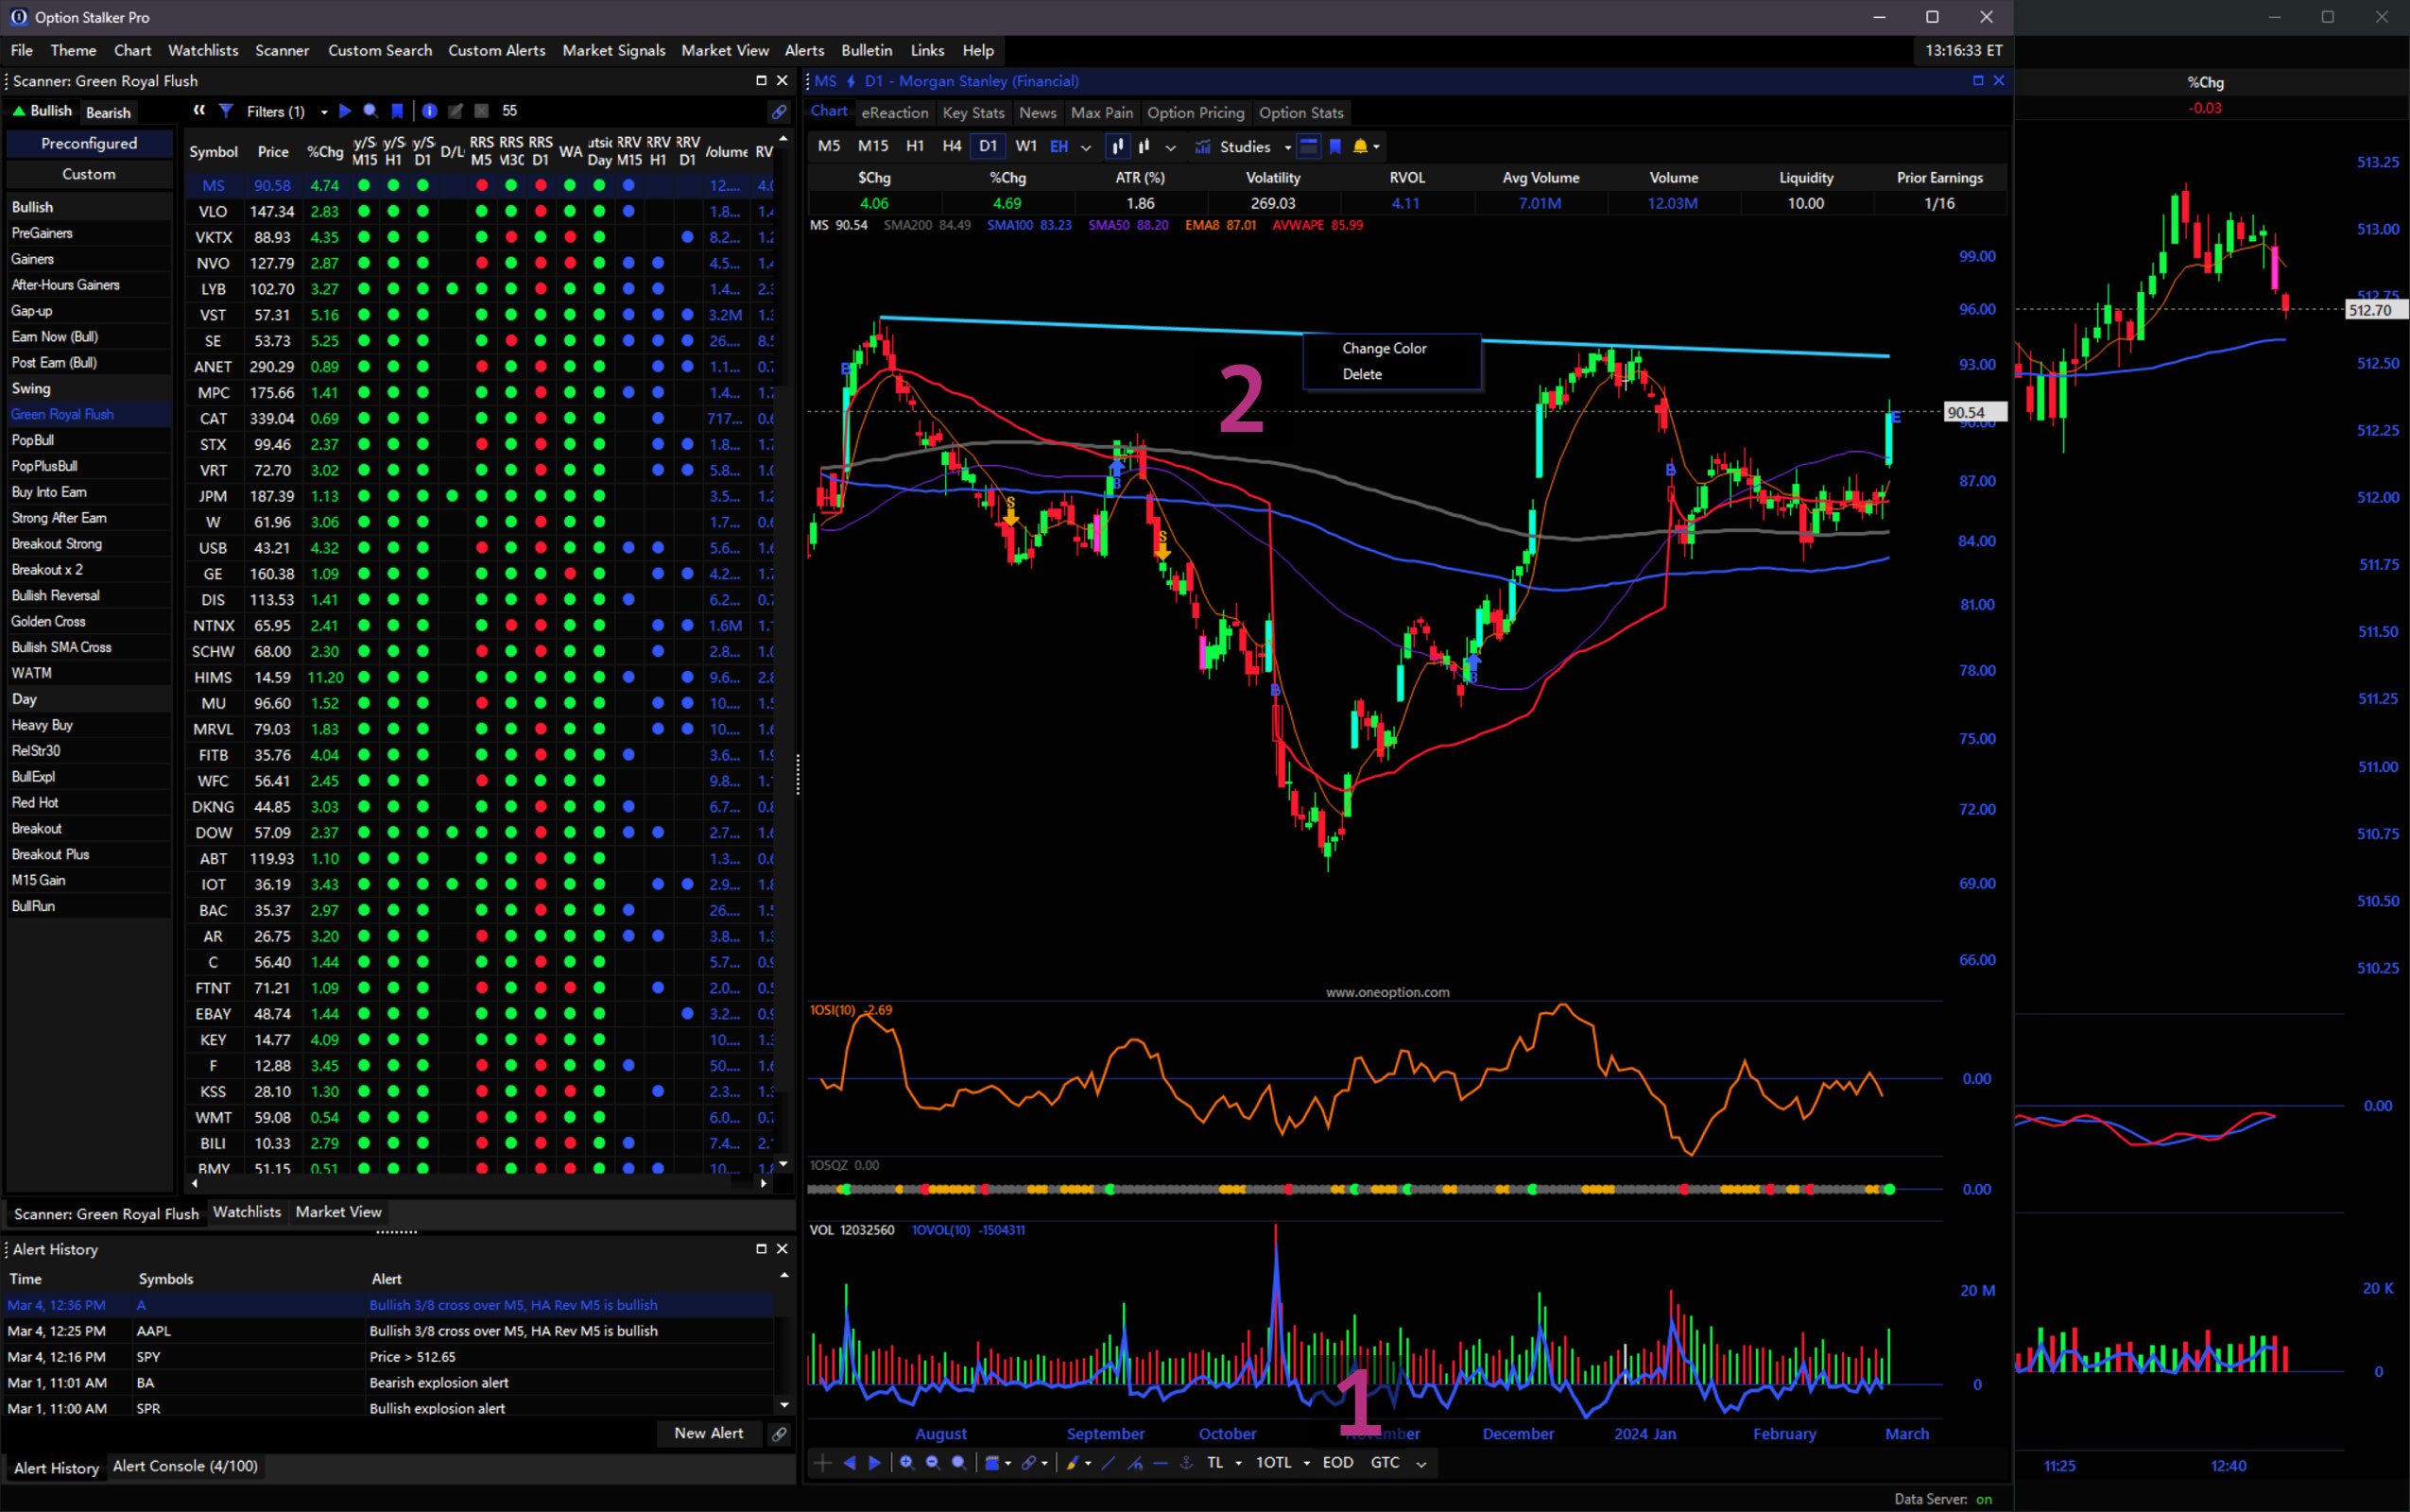
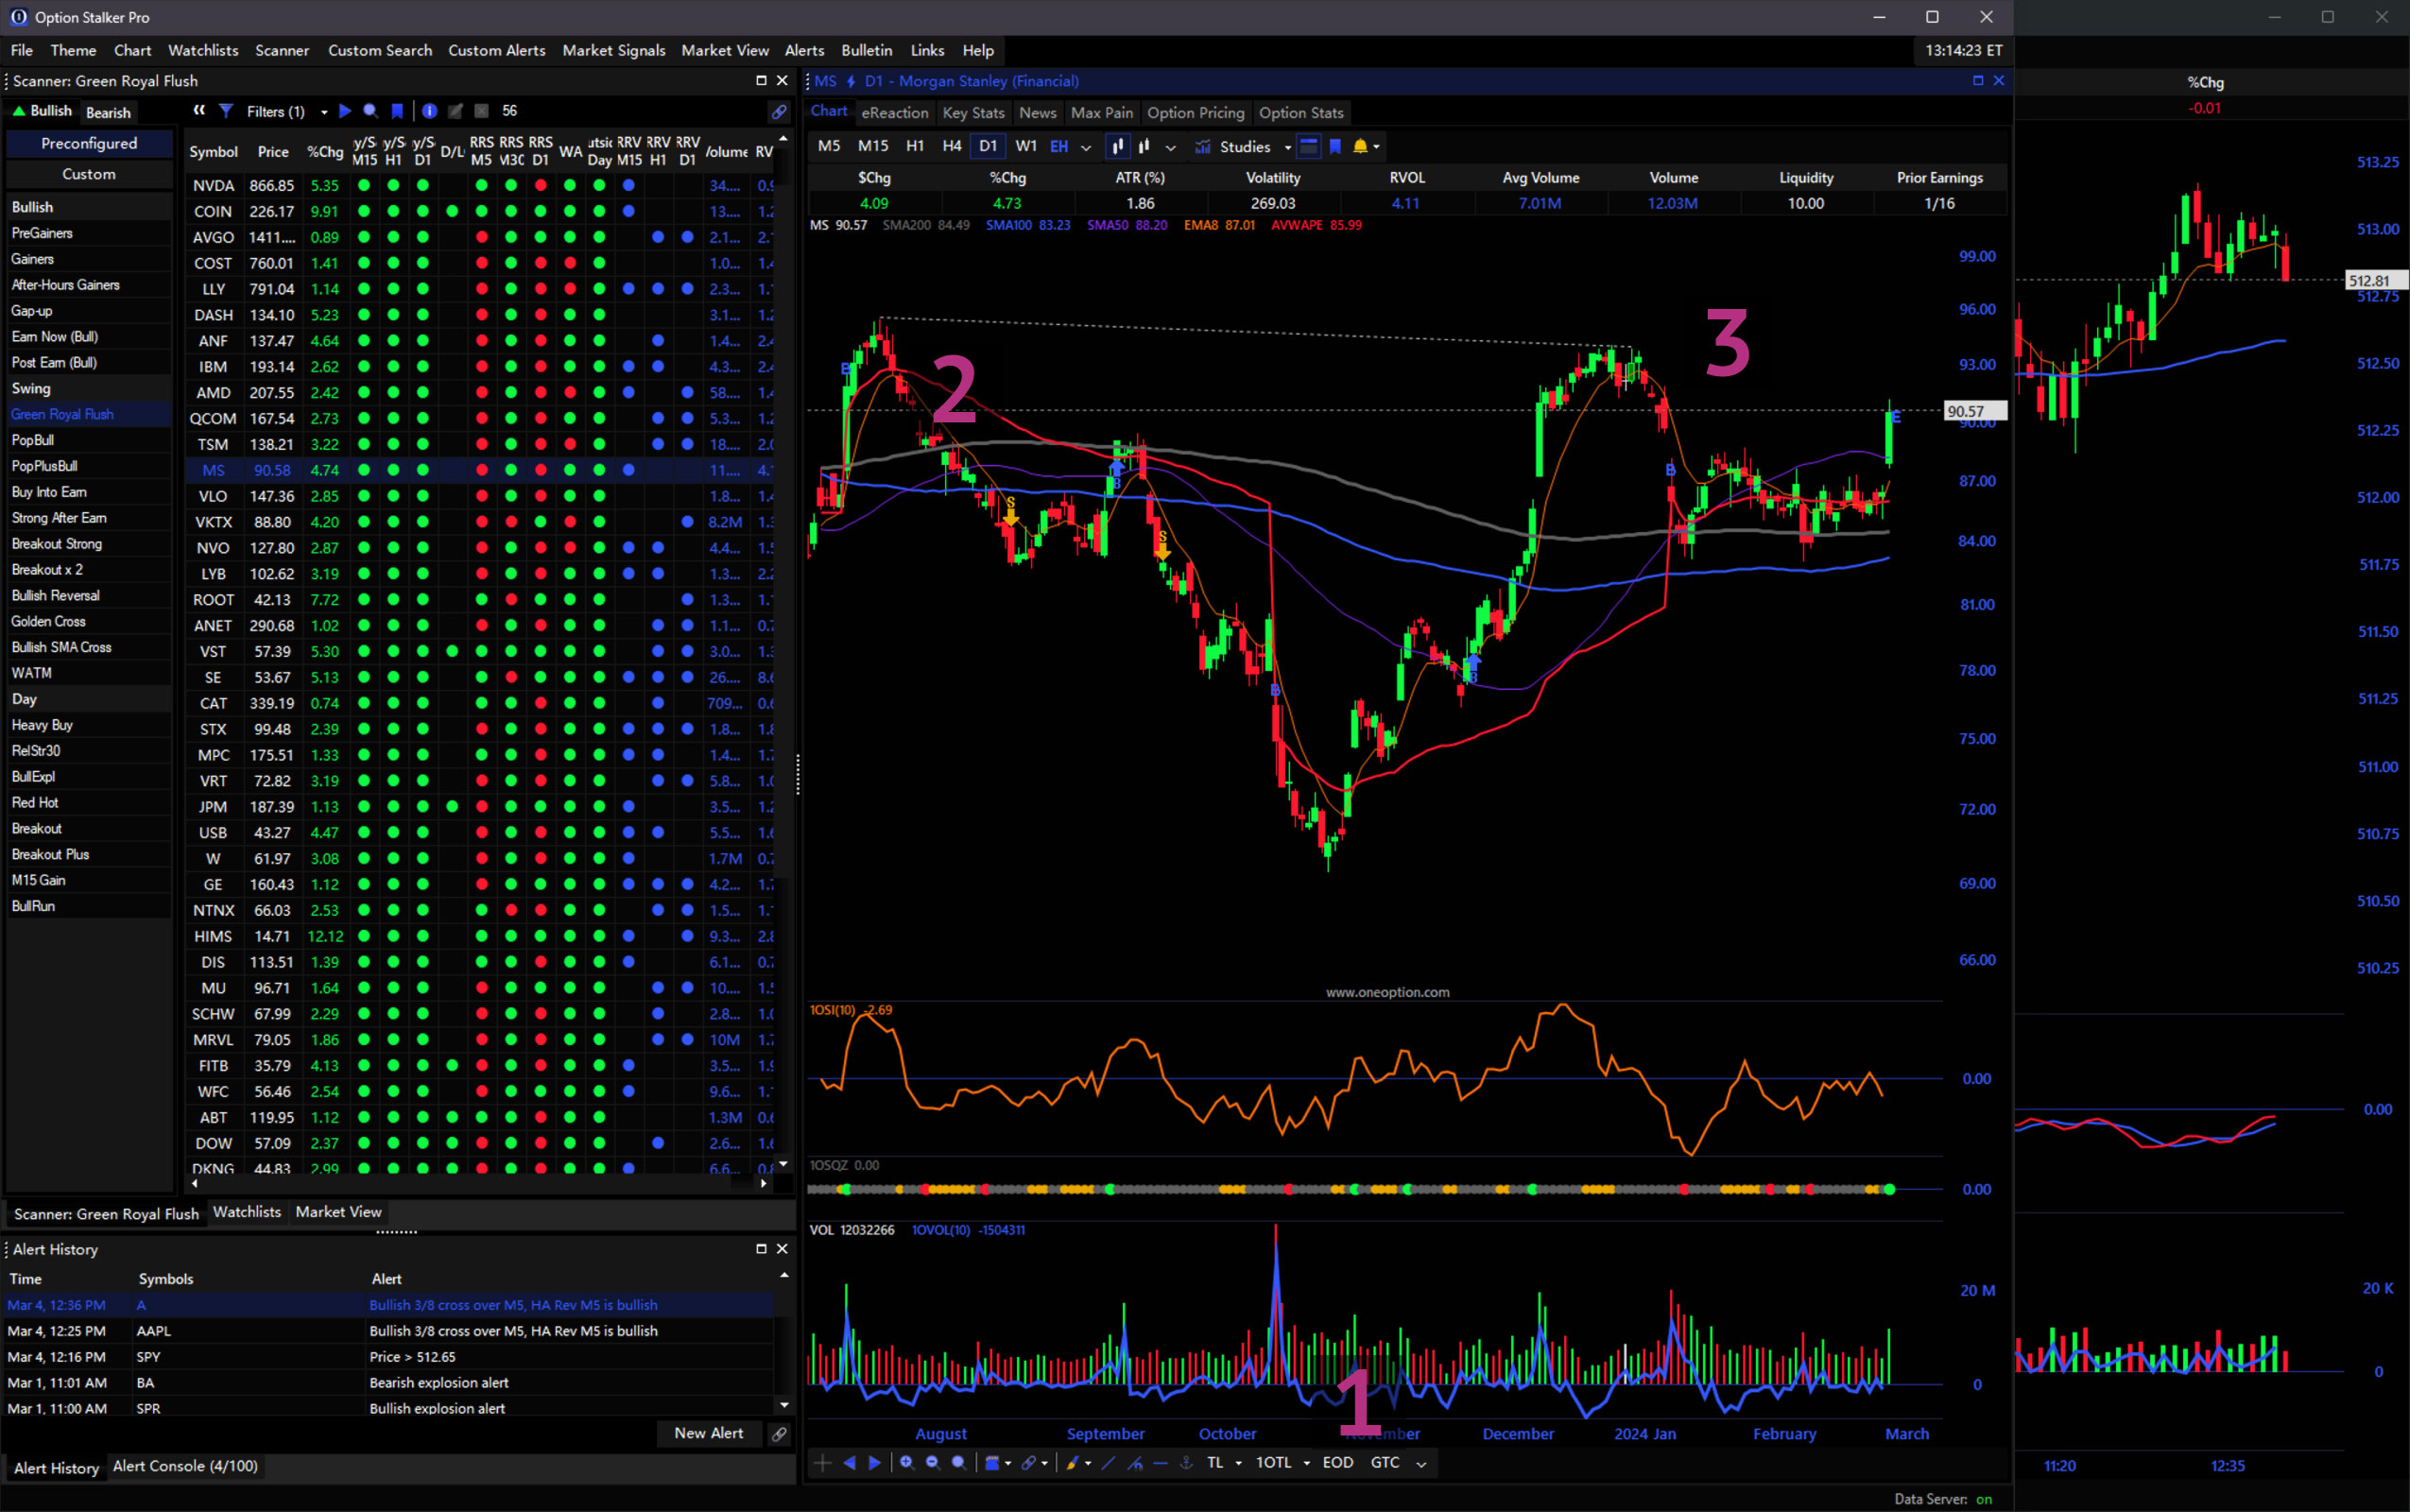
Chart alerts are located at the bottom of the chart and can dramatically improve your trading.1 You can use the EOD button to create alerts that expire at the end of the day. The GTC will create alerts that remain until cancelled. Right-Click an alert line and click Delete to cancel it. 2 Alert lines are auto-created by connecting the lows or highs of two candles.
How to create a chart alert:
- Click the EOD or GTC button
- Choose your starting candle and click the lower half of the candle to start the alert line from the low.
- Click the end candle to finish drawing the alert. In this example, the alert will connect the lows because the starting point was a low. The alert line will automatically extend over time until broken.
Learn how alerts improve your trading: How To Use Alerts To Trade
Chart Drawings
Chart drawings are available in the Drawing dropdown.1 Use the Line tool to draw simple trendlines.2 The TL dropdown can be used to toggle simple auto-drawn trendlines on your charts.3 These trendlines are used by our servers to search for trendline breaches in Scanners, Custom Search and Custom Alerts. Right-Click any drawing to customize or delete it.4 Define custom-anchored AVWAP using the anchor button.5
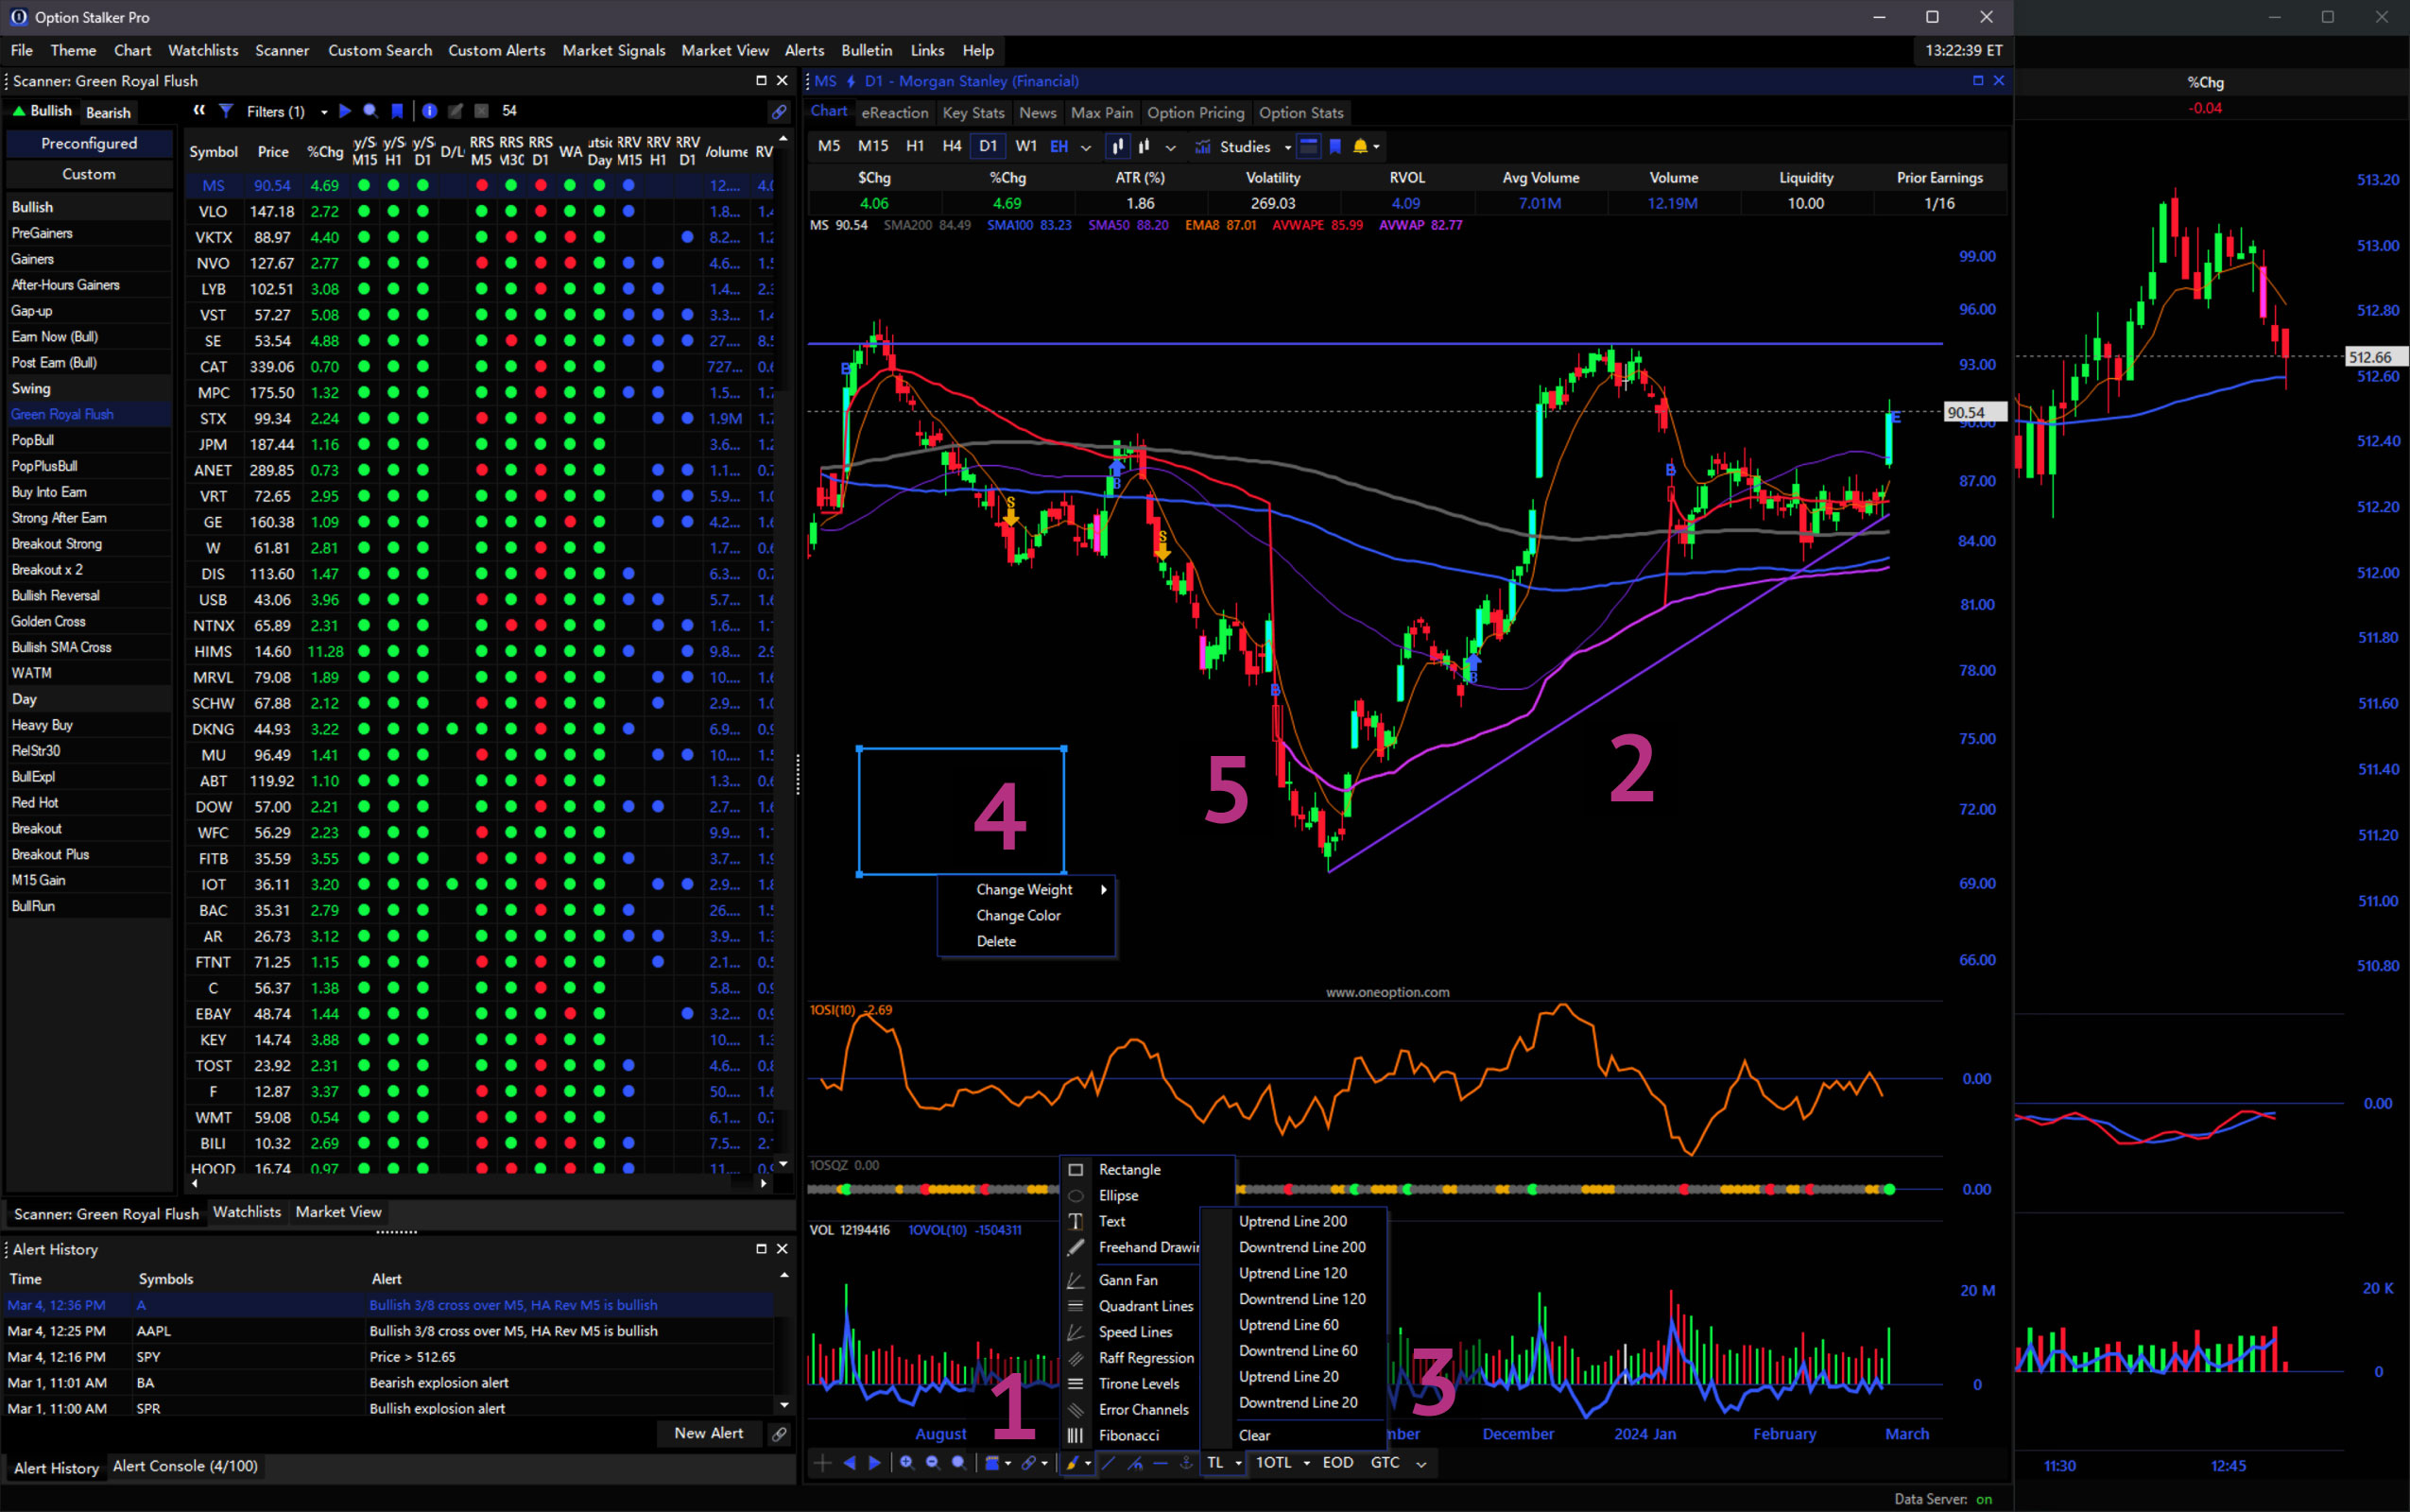
Chart HUD
The Chart HUD (Heads Up Display) is a table of information about the currently selected symbol. Toggle the HUD on/off with the HUD Button (identified by the toolbar icon).1 Right-Click the HUD to adjust visible columns.2 Your preferences will be saved with your Workspace.
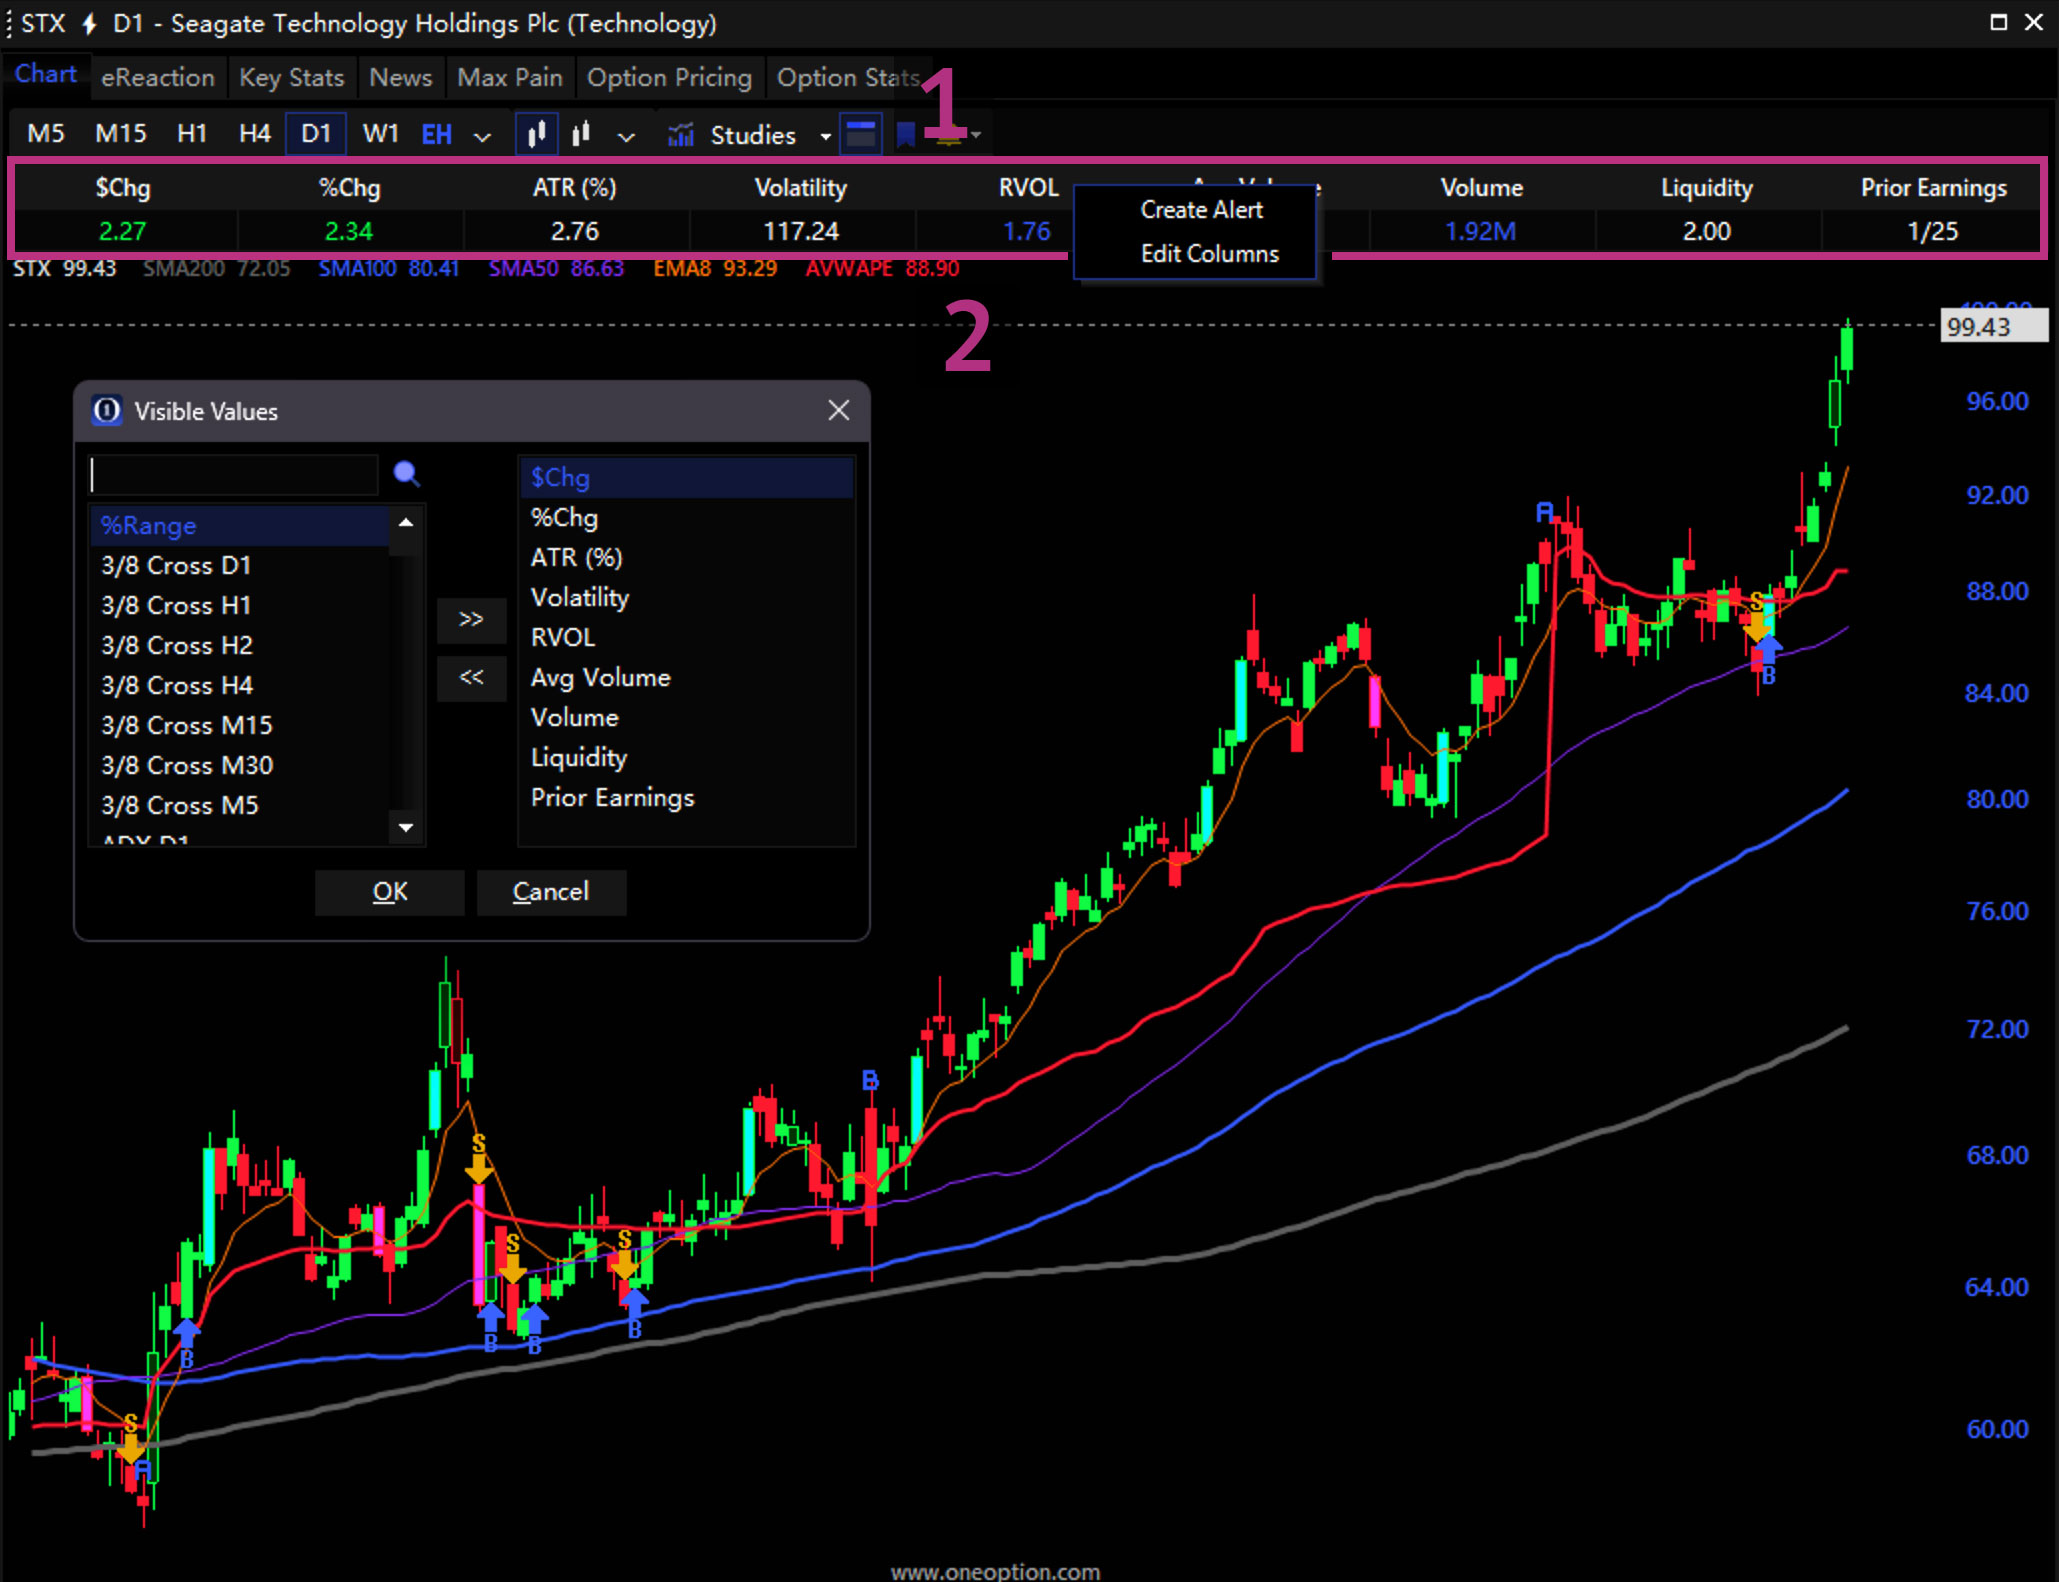
Chart Settings
Right-Click the chart area to access the chart settings.1 You can control the Scale Type, toggle Grids on/off, toggle EOD Lines, and show/hide chart Price Line, Earnings Icons on daily charts, and Intraday Price Lines (EOD Lines) on intraday charts. When Earnings Icons are active, hover over the “E” after the last bar to view the next earnings release date.2 An “A” on the chart means the company reported earnings after the close and a “B” means it reported before the open.
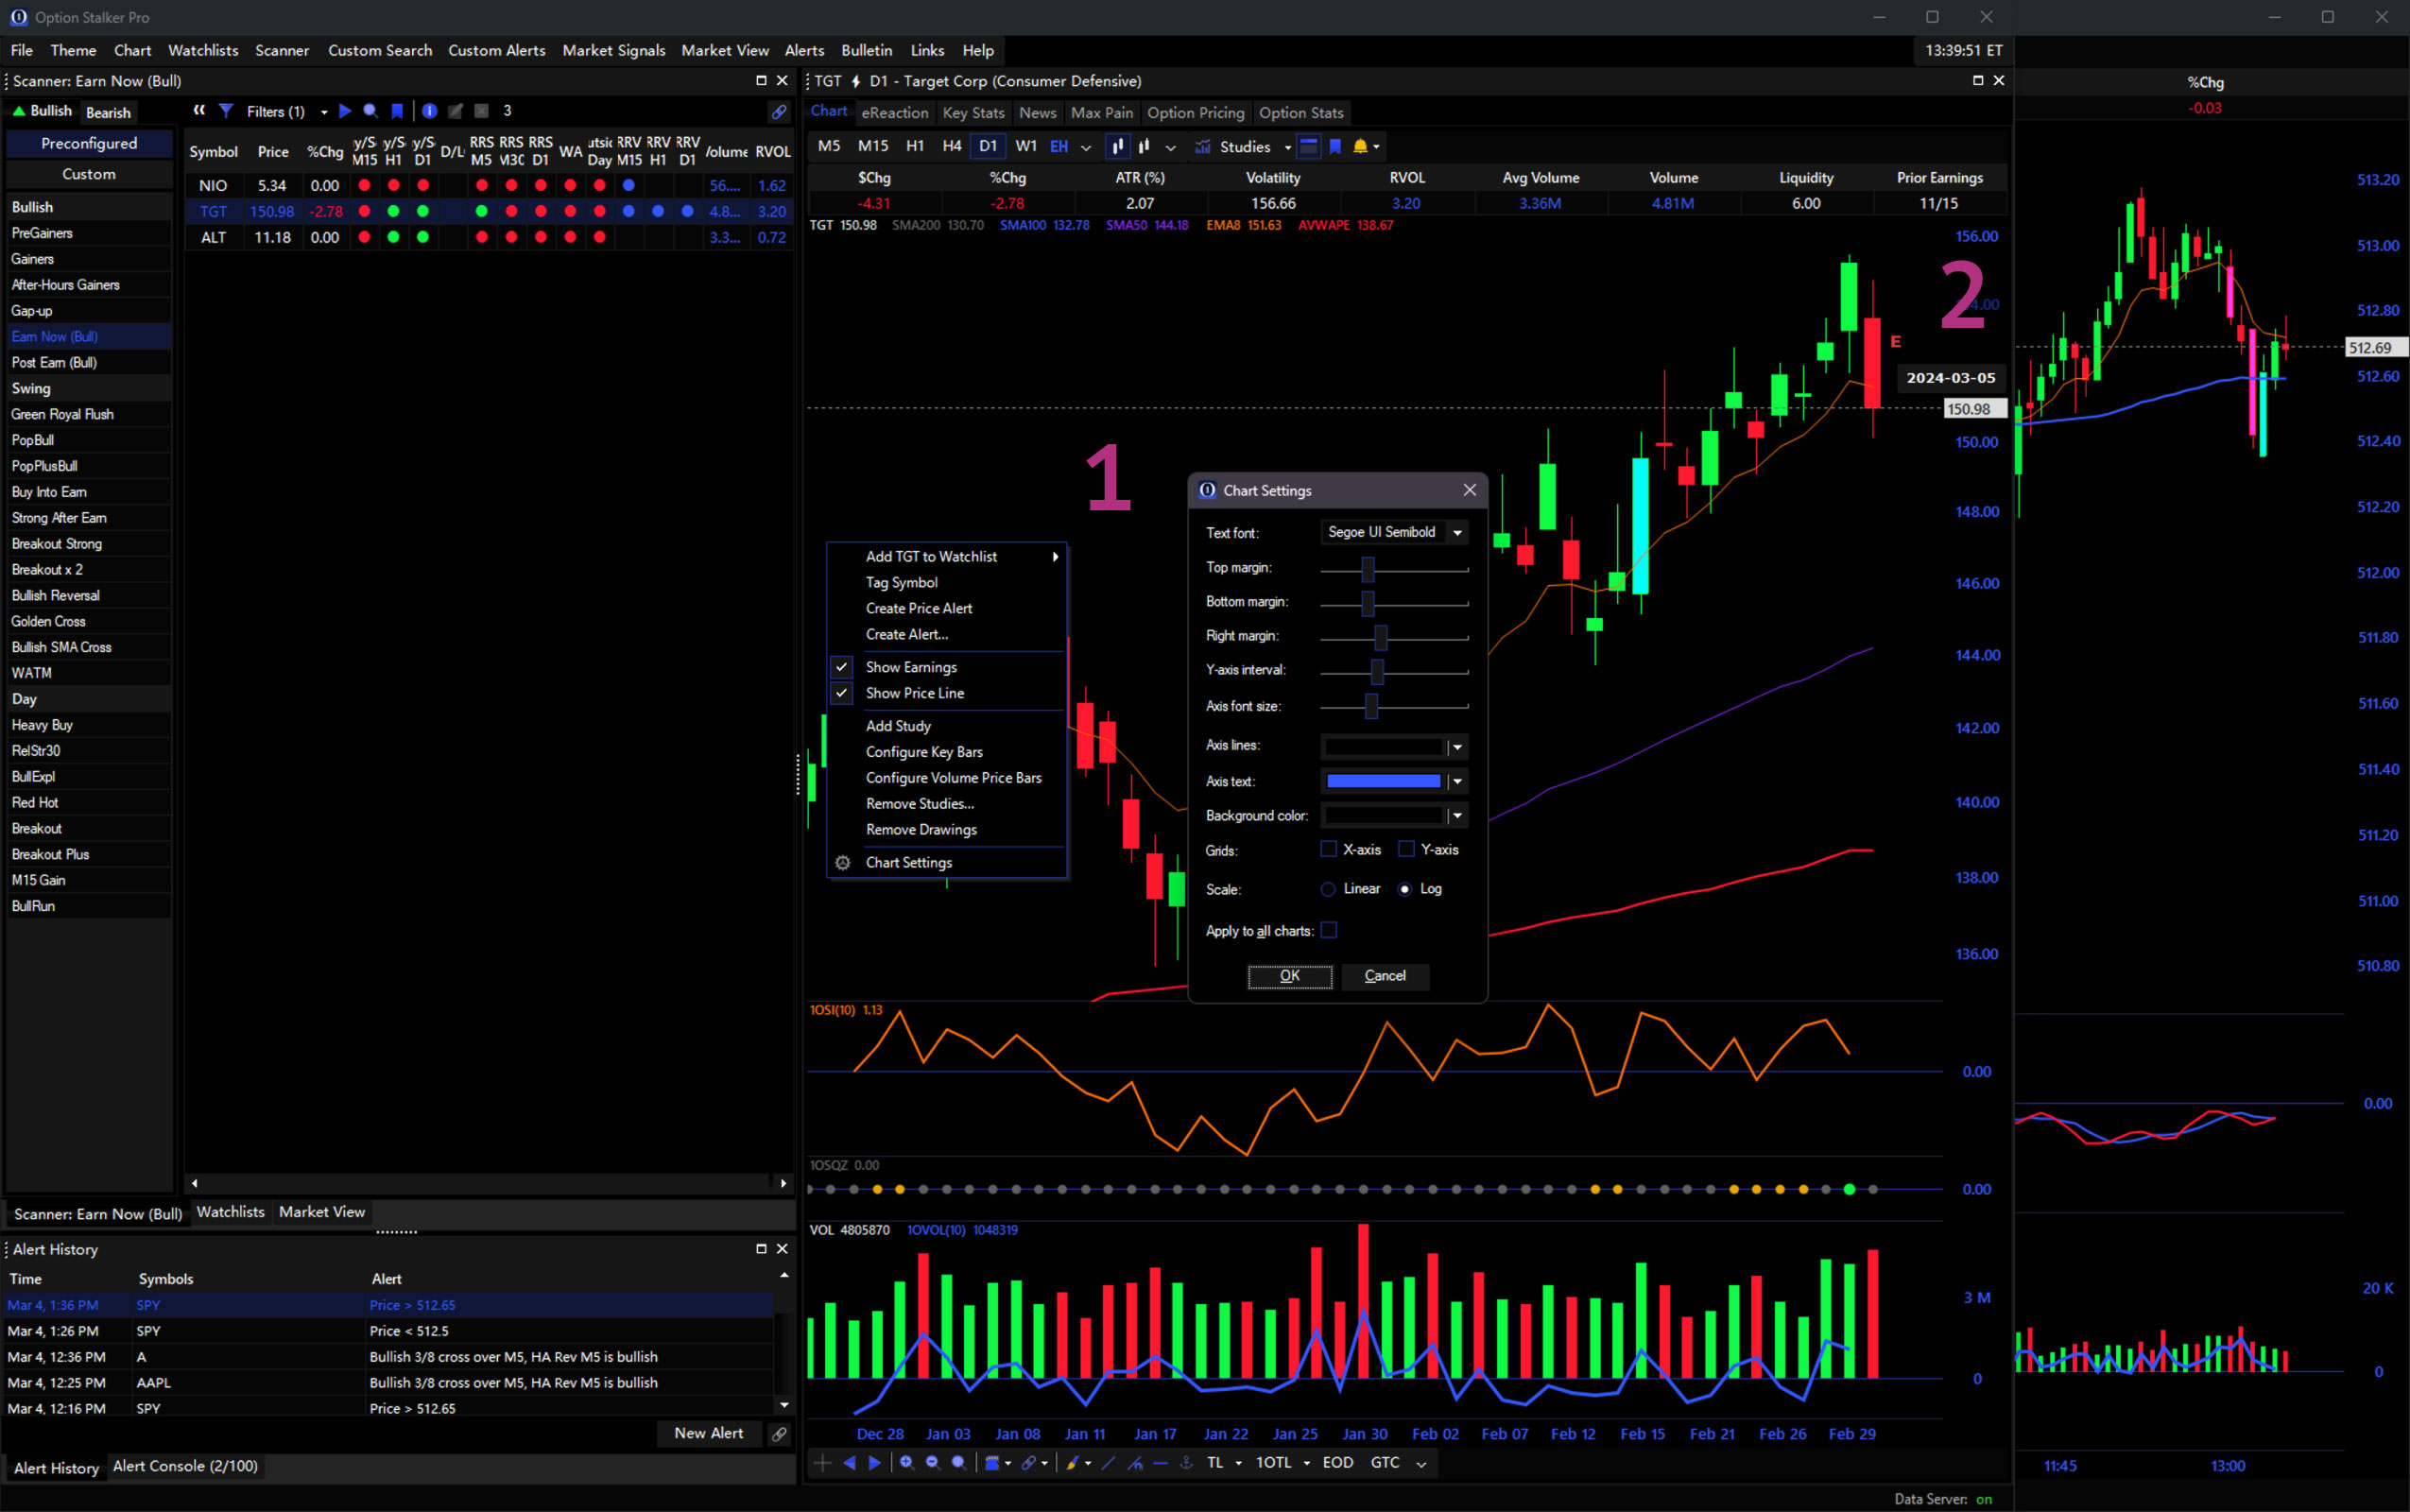
Chart Trade Entry
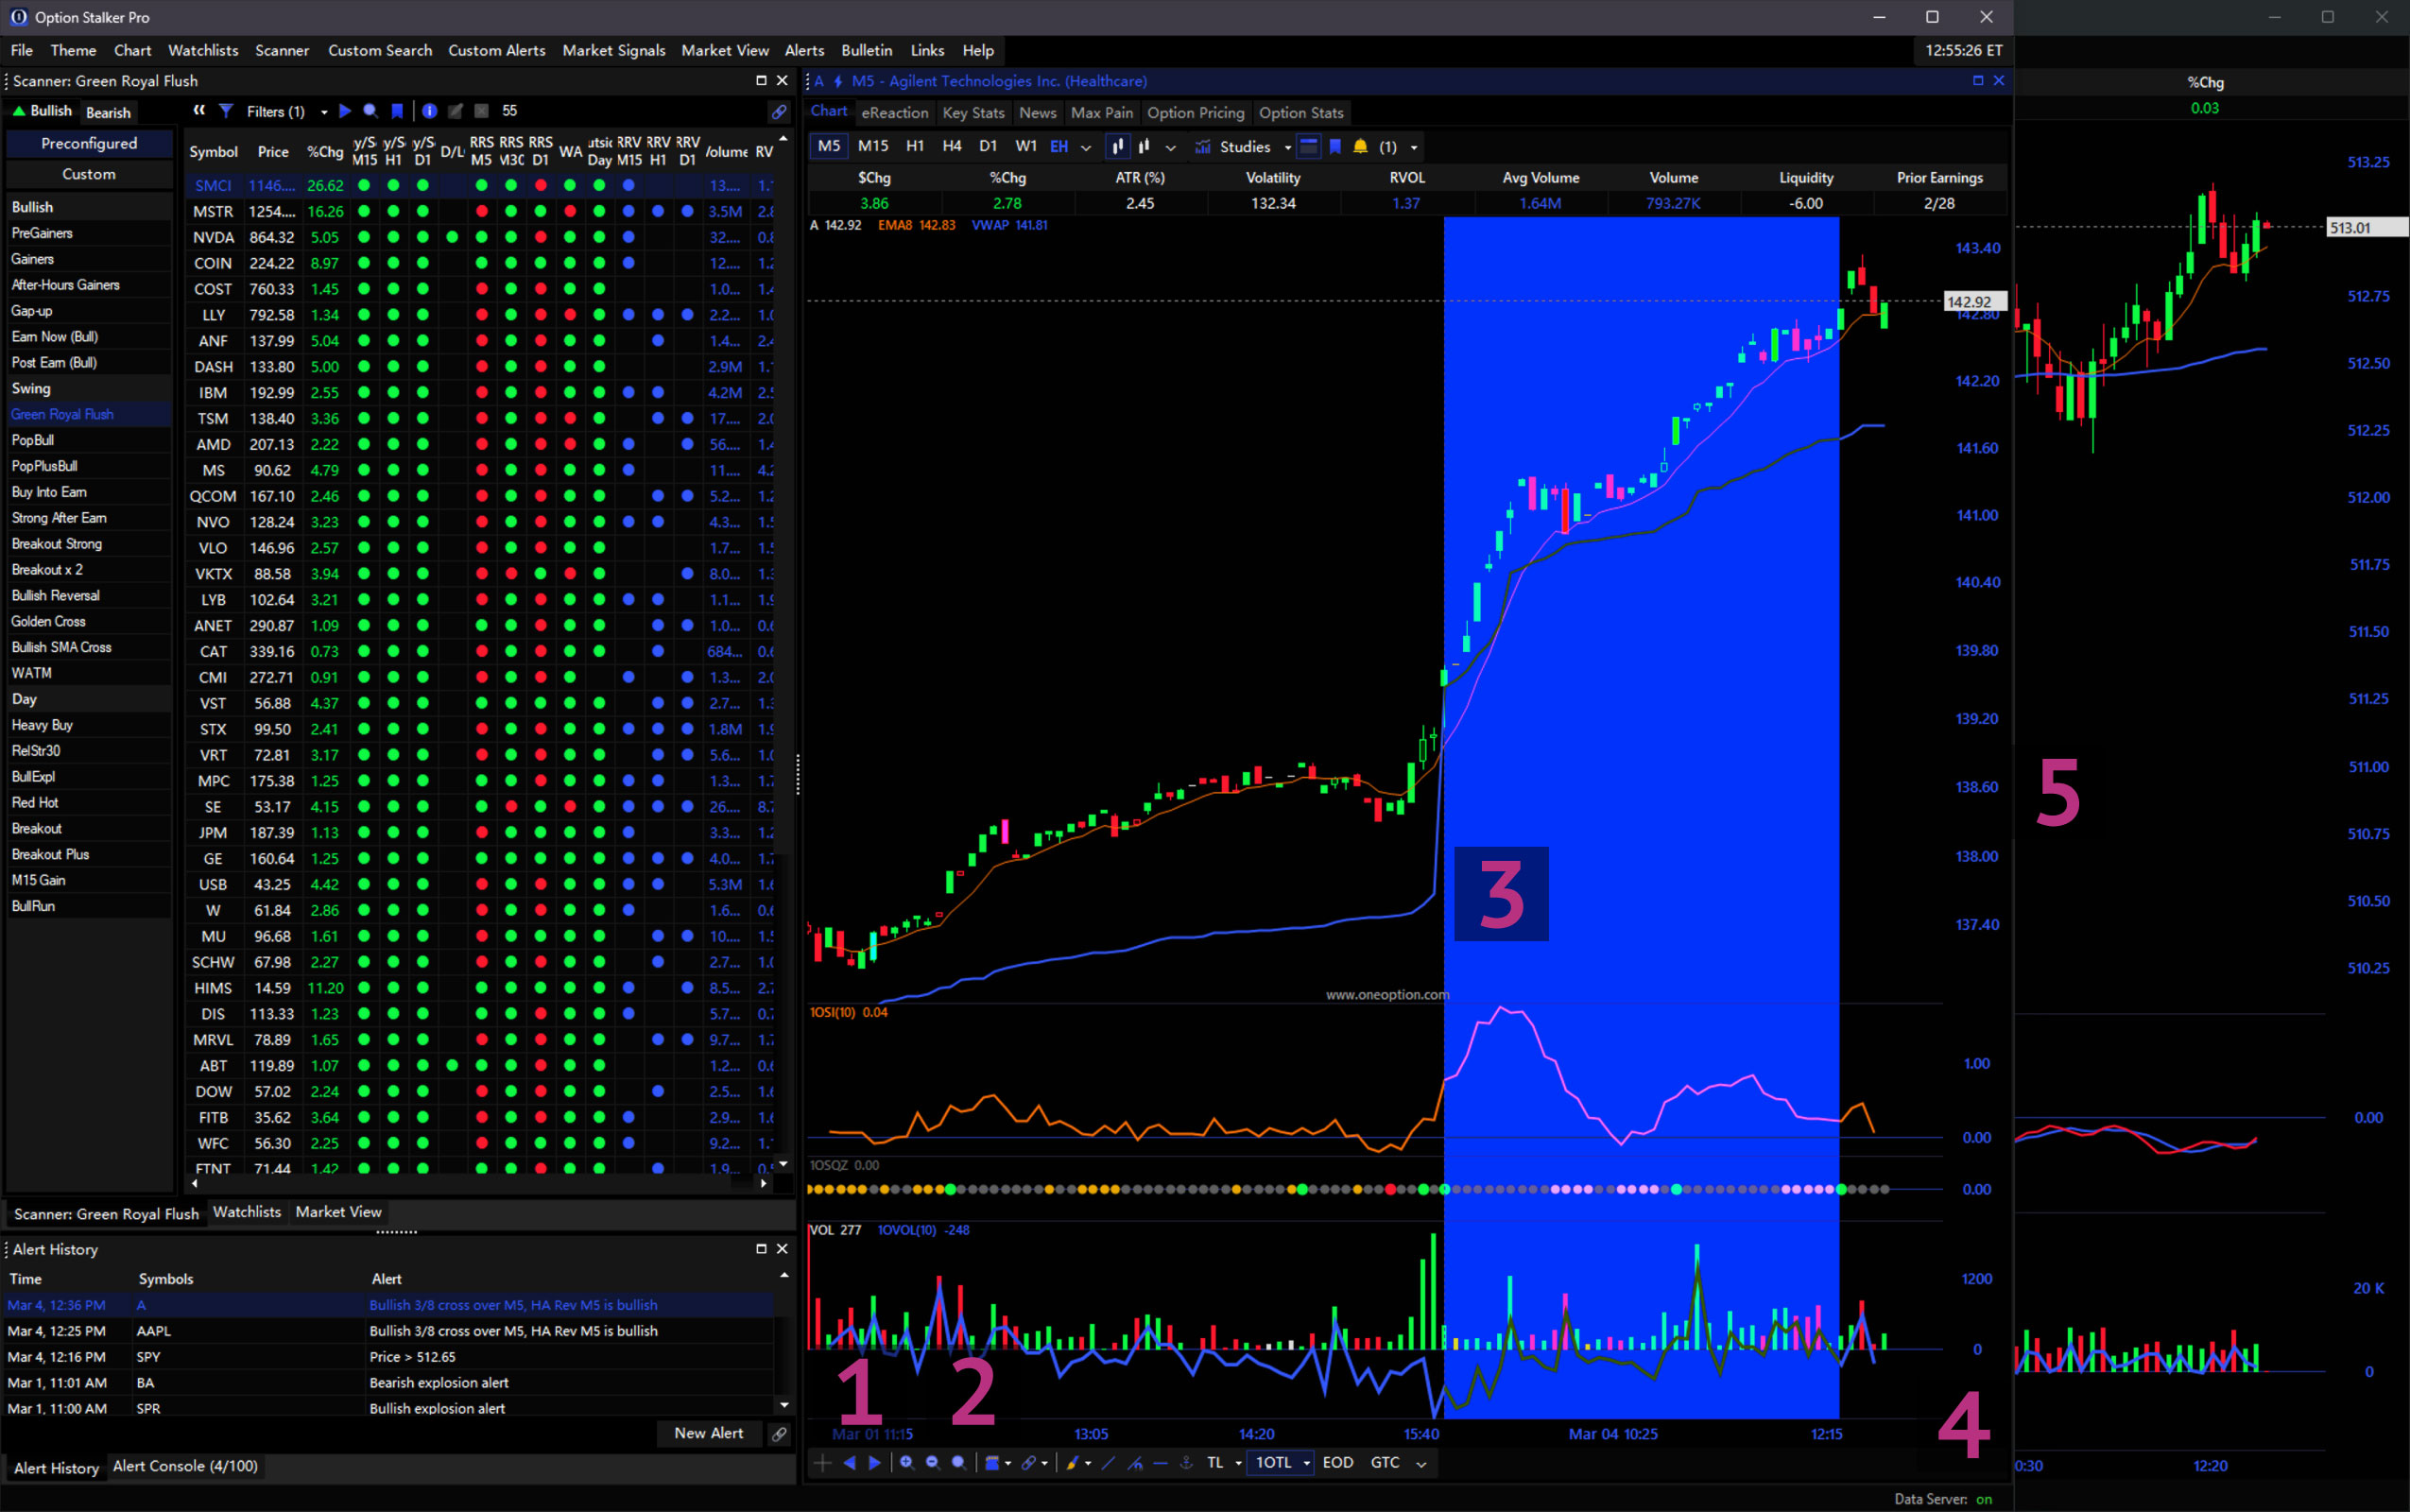
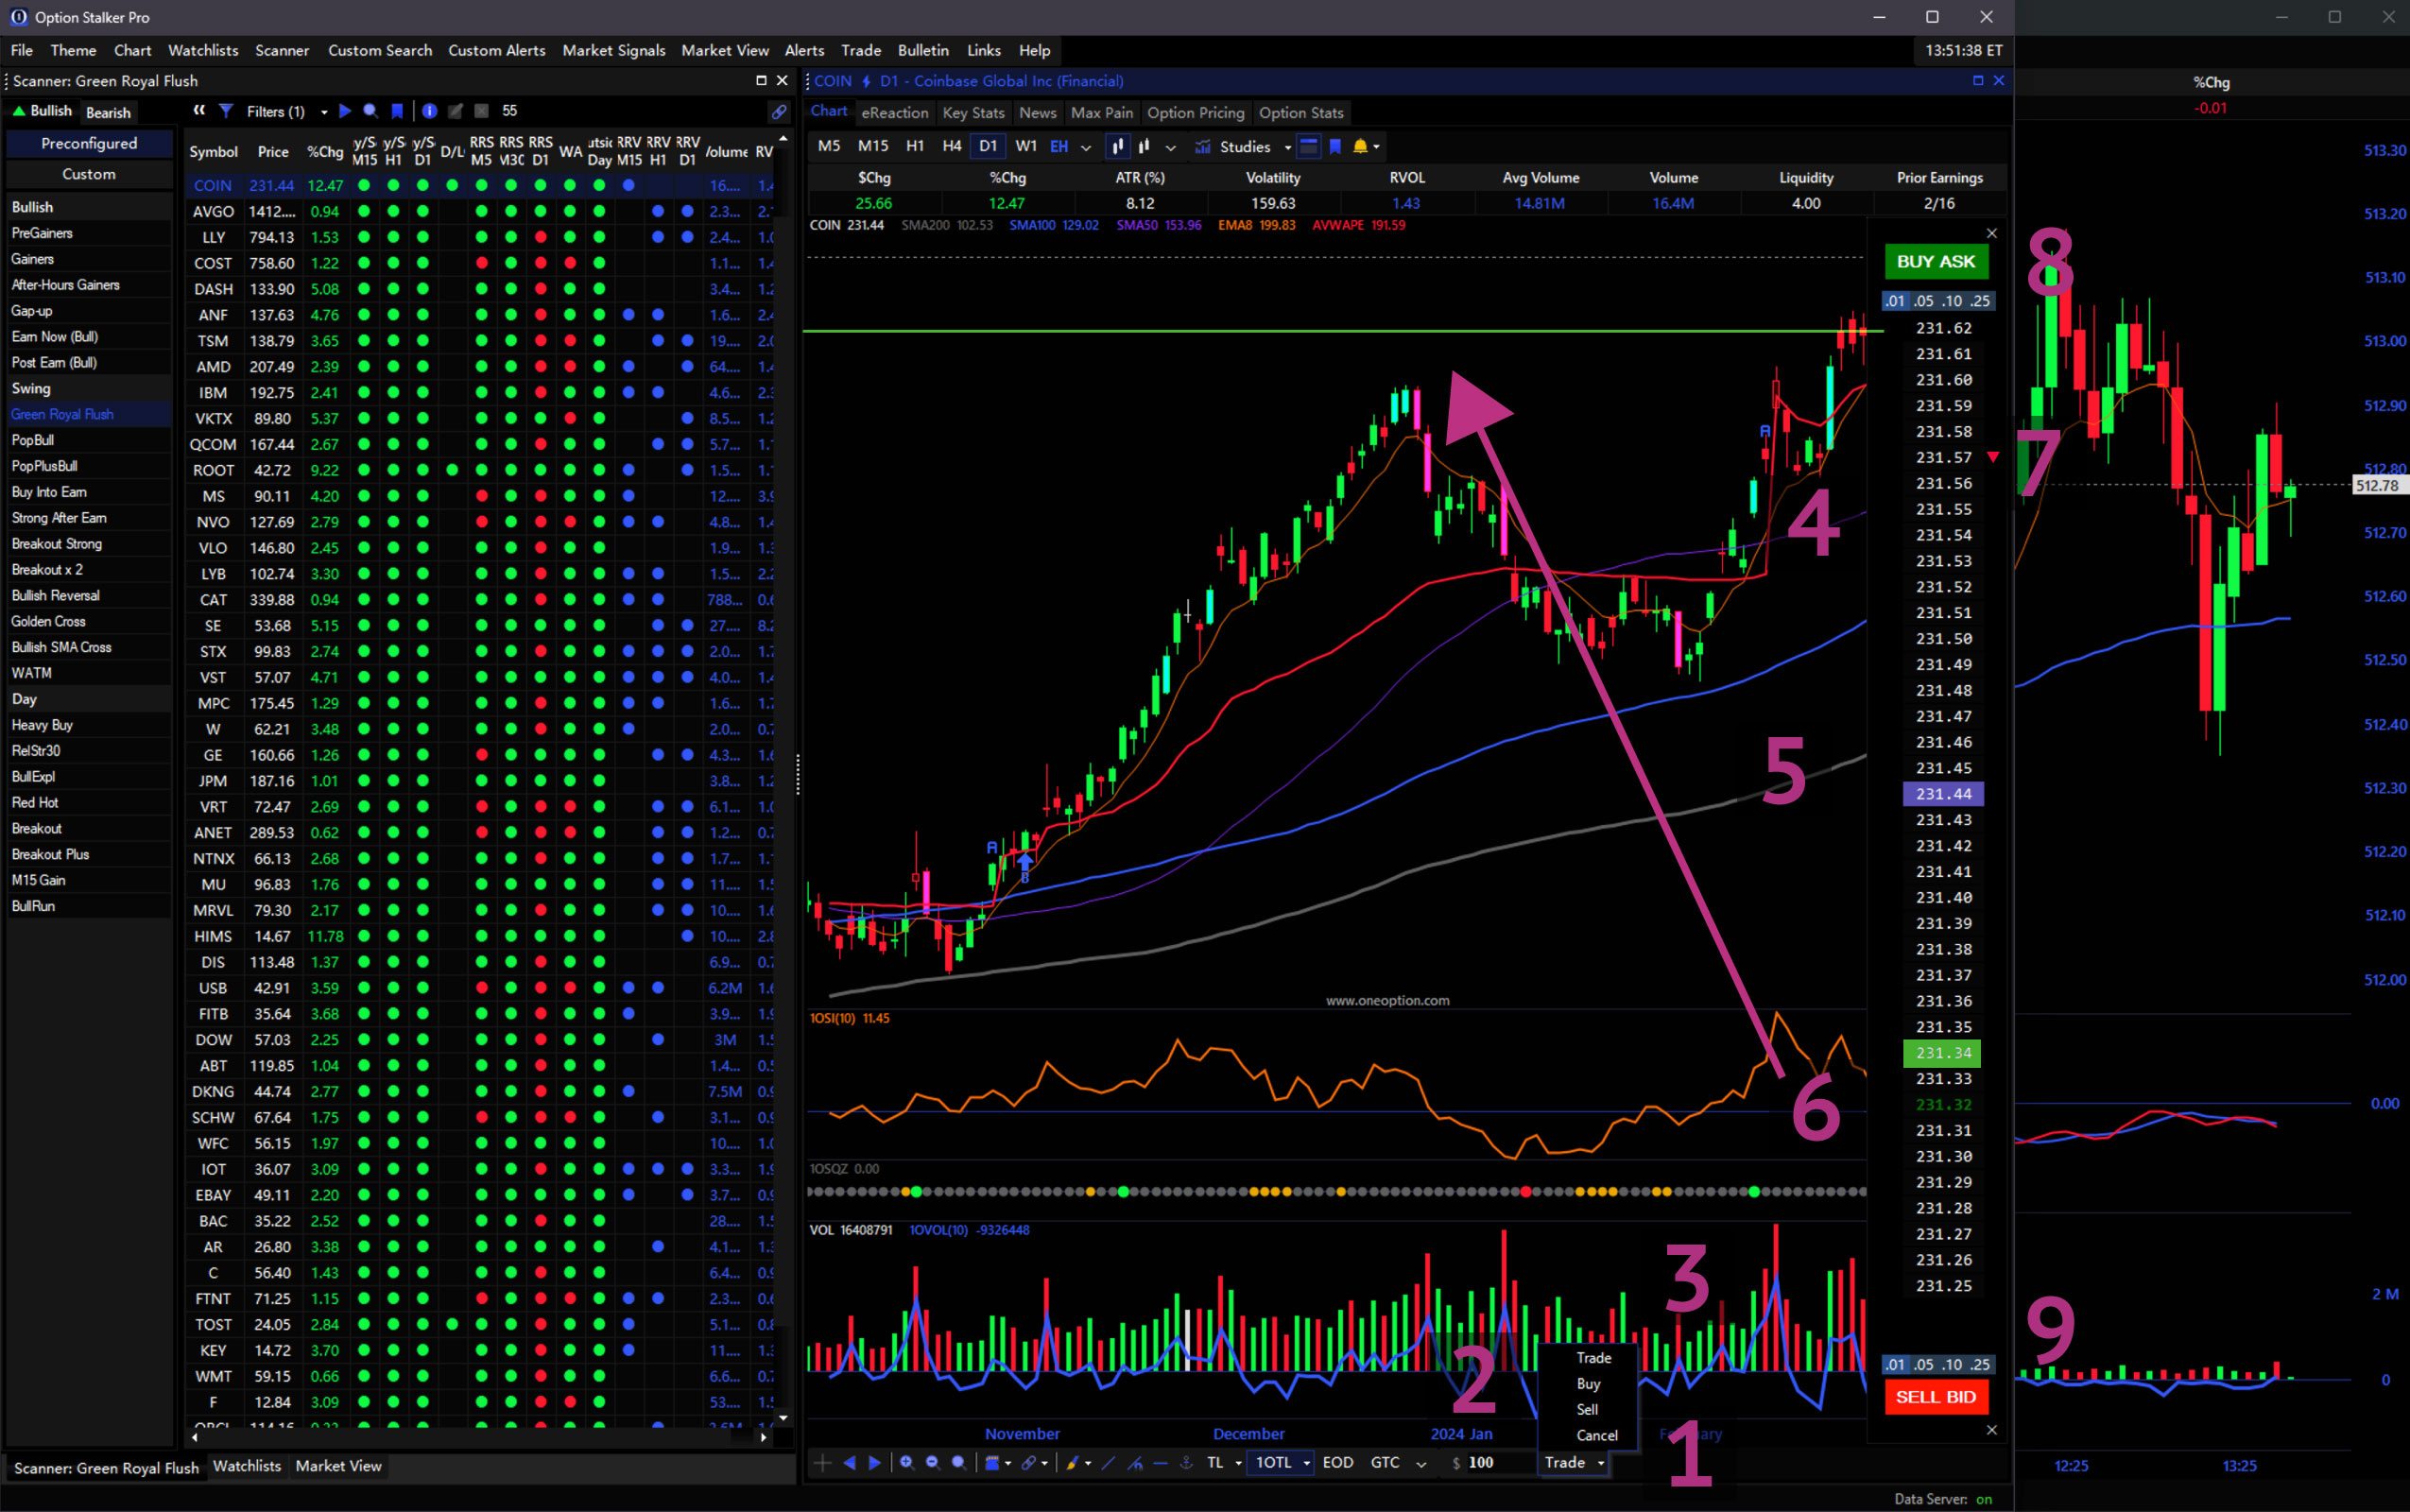
You can trade directly from a Chart using the Trade dropdown in the bottom toolbar.1 Enter the Allocation Amount in the Trade Input Field.2 The system will use this to calculate the number of shares automatically. Click Buy or Sell in the Trade dropdown to initiate an order.3 The Price Bar will open on the right of the chart.4 The Last price is highlighted in blue and updates in real-time.5 Open orders are highlighted in green (for Buy orders) or red (for Sell orders) in the Price Bar, and indicated by a horizontal line on the chart.6 The average price of existing positions is indicated by a green arrow (when long) or red arrow (when short).7 To submit your order, click the desired price or use the Buy Ask or Sell Bid buttons.8 For Buy orders, a Stop Market Order will submit if you place the order above the current price, and a Limit Order will submit if you place the order below the current price. The opposite is true for Sell orders. Use the mouse wheel or Increment Buttons9 to adjust the price increments in the Price Bar. At any time, click the Cancel button to clear all orders for this stock.
If you submit a trade in the opposite direction of your position, the system will ignore the Allocation Amount and instead close your position with an order of the same number of shares.
For more trade entry methods, please refer to the Trade section below.
Chart Keyboard Shortcuts
Keyboard shortcuts when a chart is selected include:
- Type any letter character (
A-Z) to open Change Chart window and change symbol - Type any number character (
0-9) to open Change Chart window and change timeframe/interval Shift+Clickchart area to activate Zoom In interactionCtrl+Clickchart area to zoom outShift+Clickchart arrows and magnifying glasses to move or zoom a larger interval- Hold Shift over the chart to toggle crosshair for quick price check
Ctrl+Rto refresh chartCtrl+ClickChart in Main Menu to open new chart window as a panel- Left and right arrows (
←,→) scroll backwards and forward in time - Up and down arrows (
↑,↓) expand & compress chart vertically +and-zoom in and out. HoldShiftwhile pressing these to increase zoom amount.
Watchlists
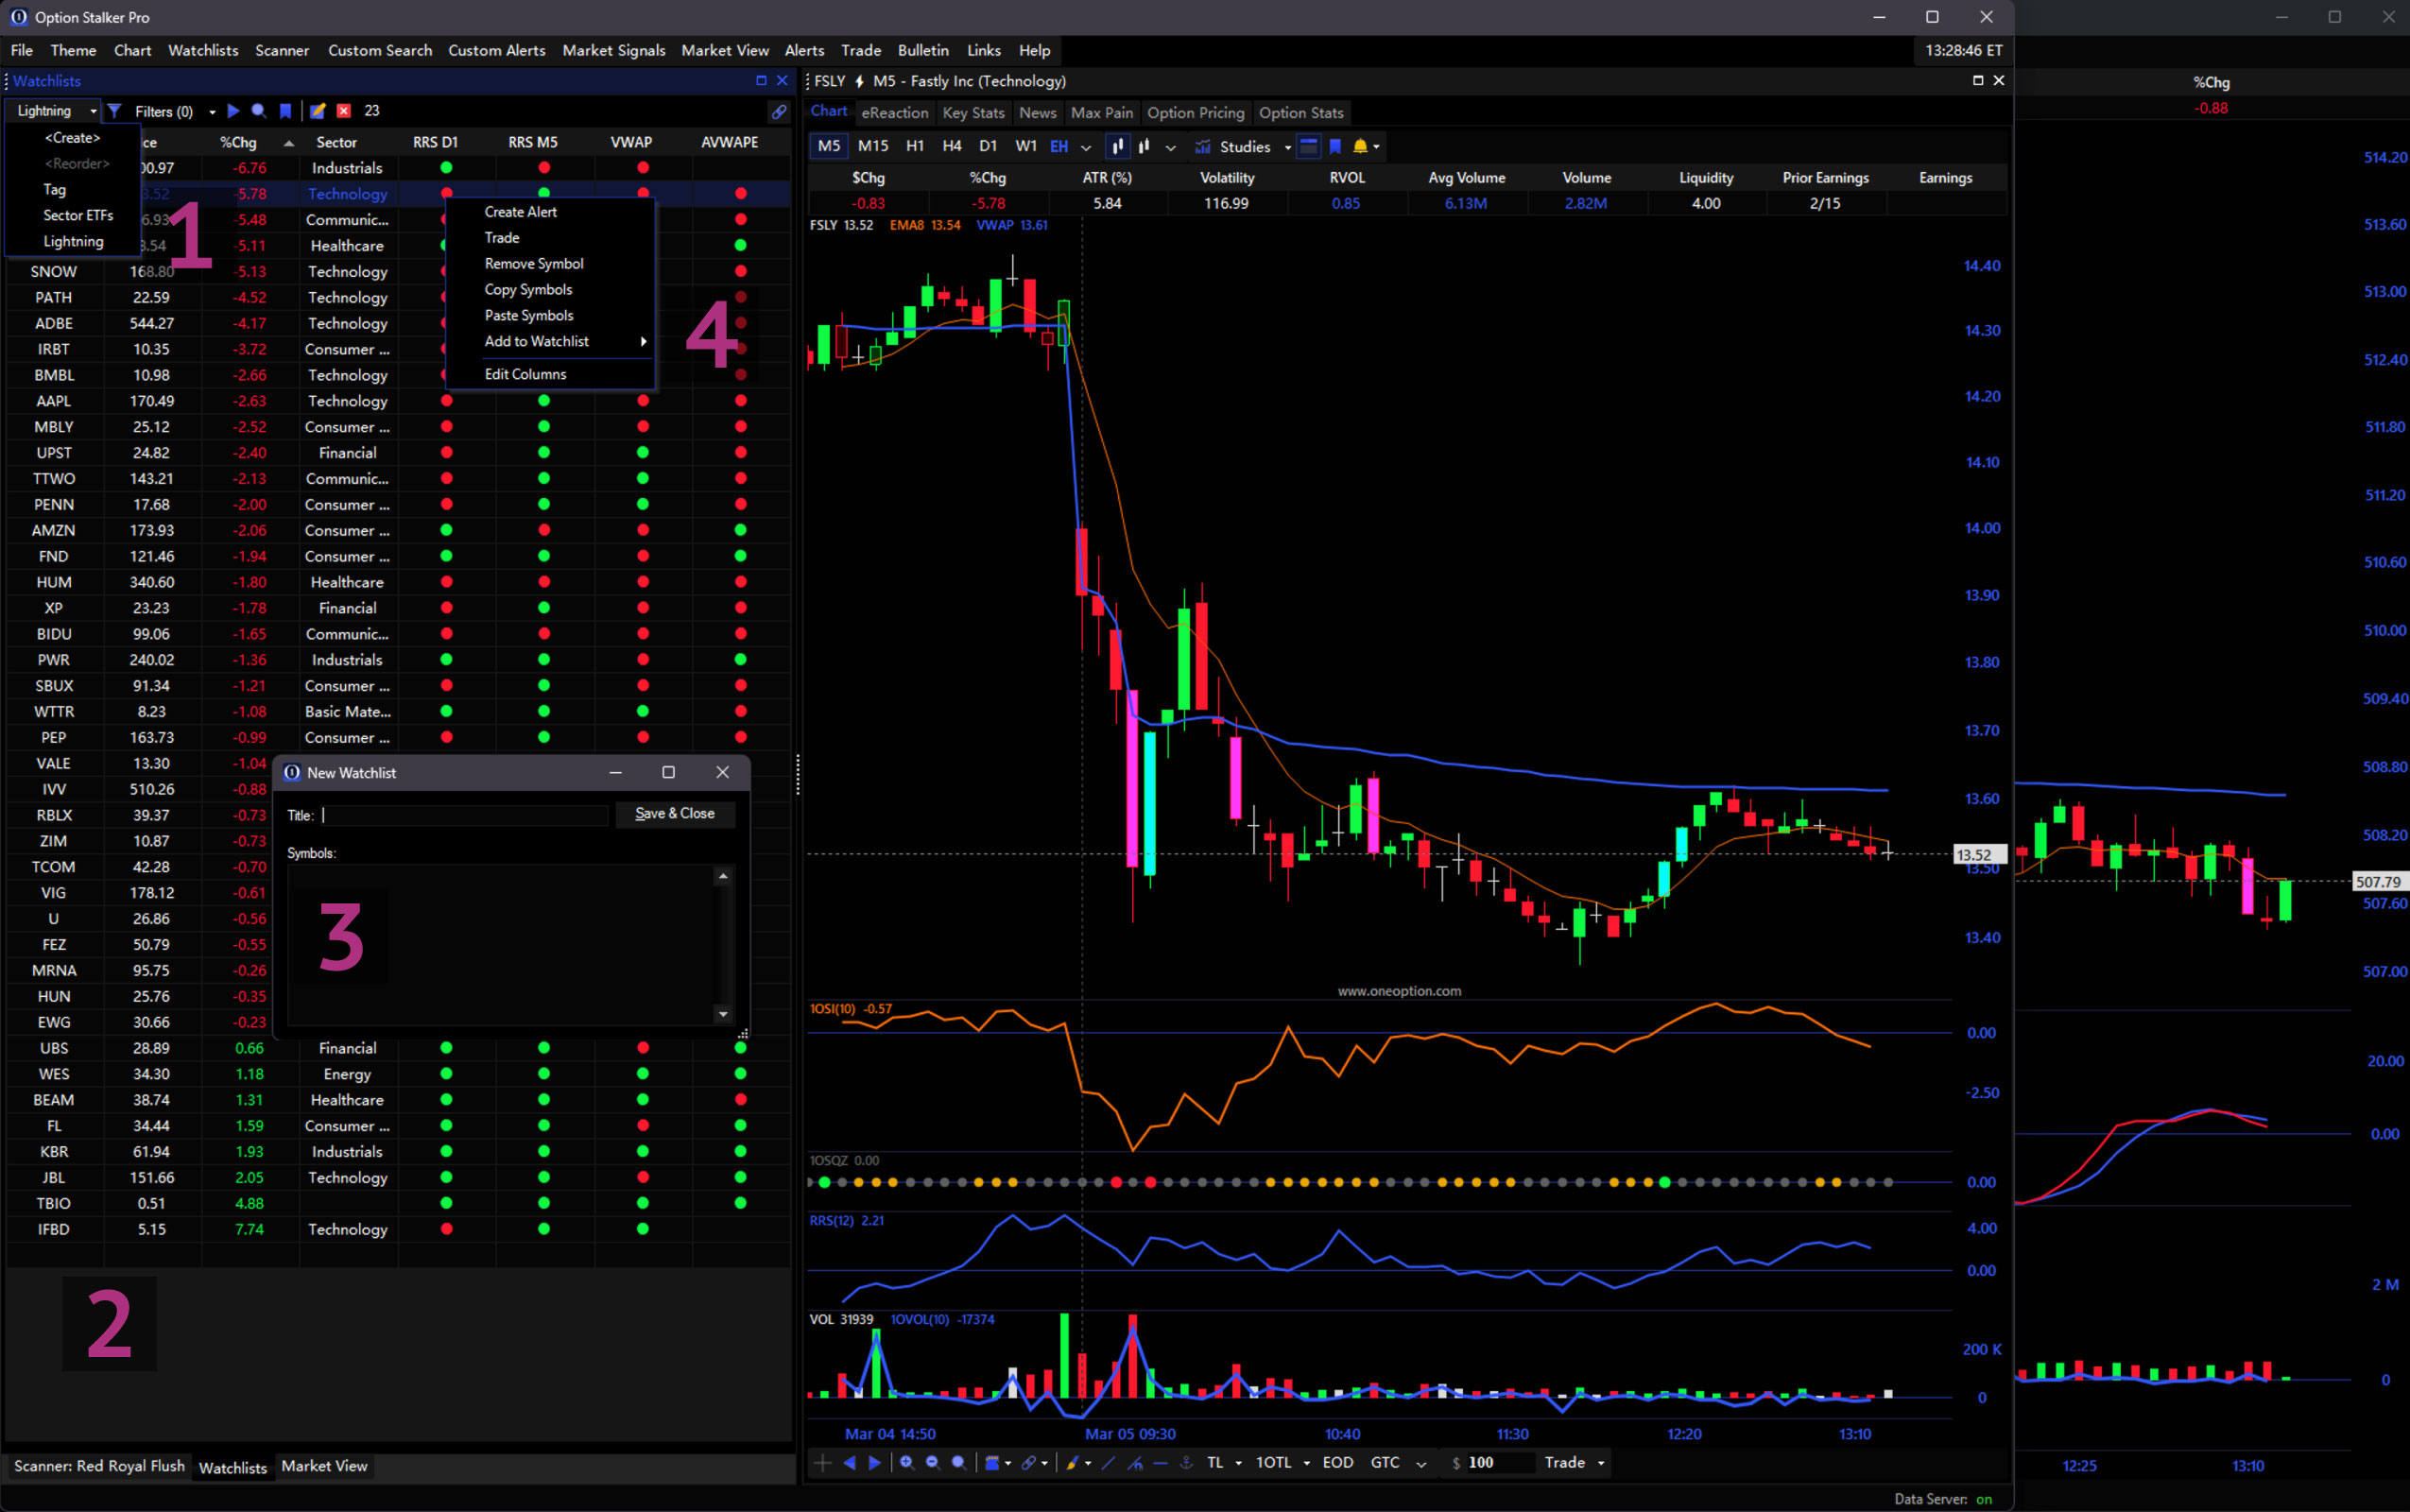
The Watchlists panel is where you create, save and update your Watchlists. Select a list using the dropdown in the upper-left to view its contents in the table below.1 Add stocks to an existing list by clicking on an empty field to type the symbol.2 To create a new watchlist, click <Create> in the dropdown to open the New Watchlist window.3 To adjust visible columns, Right-Click the table area and click Edit Columns.4 These settings will save with your Workspace. You can also Right-Click a row and select Append To List to add a symbol to an existing Watchlist.
Watchlist Header
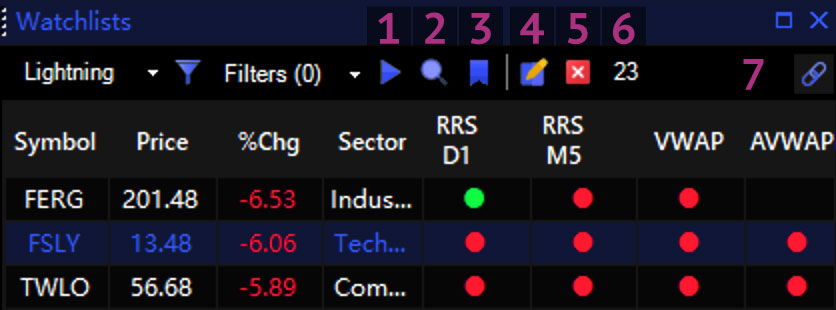
The List Header contains valuable functions for interacting with lists. Here, you can Auto-flip through symbols in a list using the Play button.1 After clicking this, the List pane will select a new symbol every few seconds and display it charts linked by Link Groups. Pressing Return/Enter on your keyboard will also start/stop this feature. Search for symbols using the Magnifying Glass button.2 The Bookmark button will tag the selected symbol (see below for more information on Tags).3 Rename the watchlist with the Edit button. 4 Use the Trash button to delete a list.5 Quickly see the number of symbols in a list with the count icon.6 Link the list panel with the Link dropdown.7
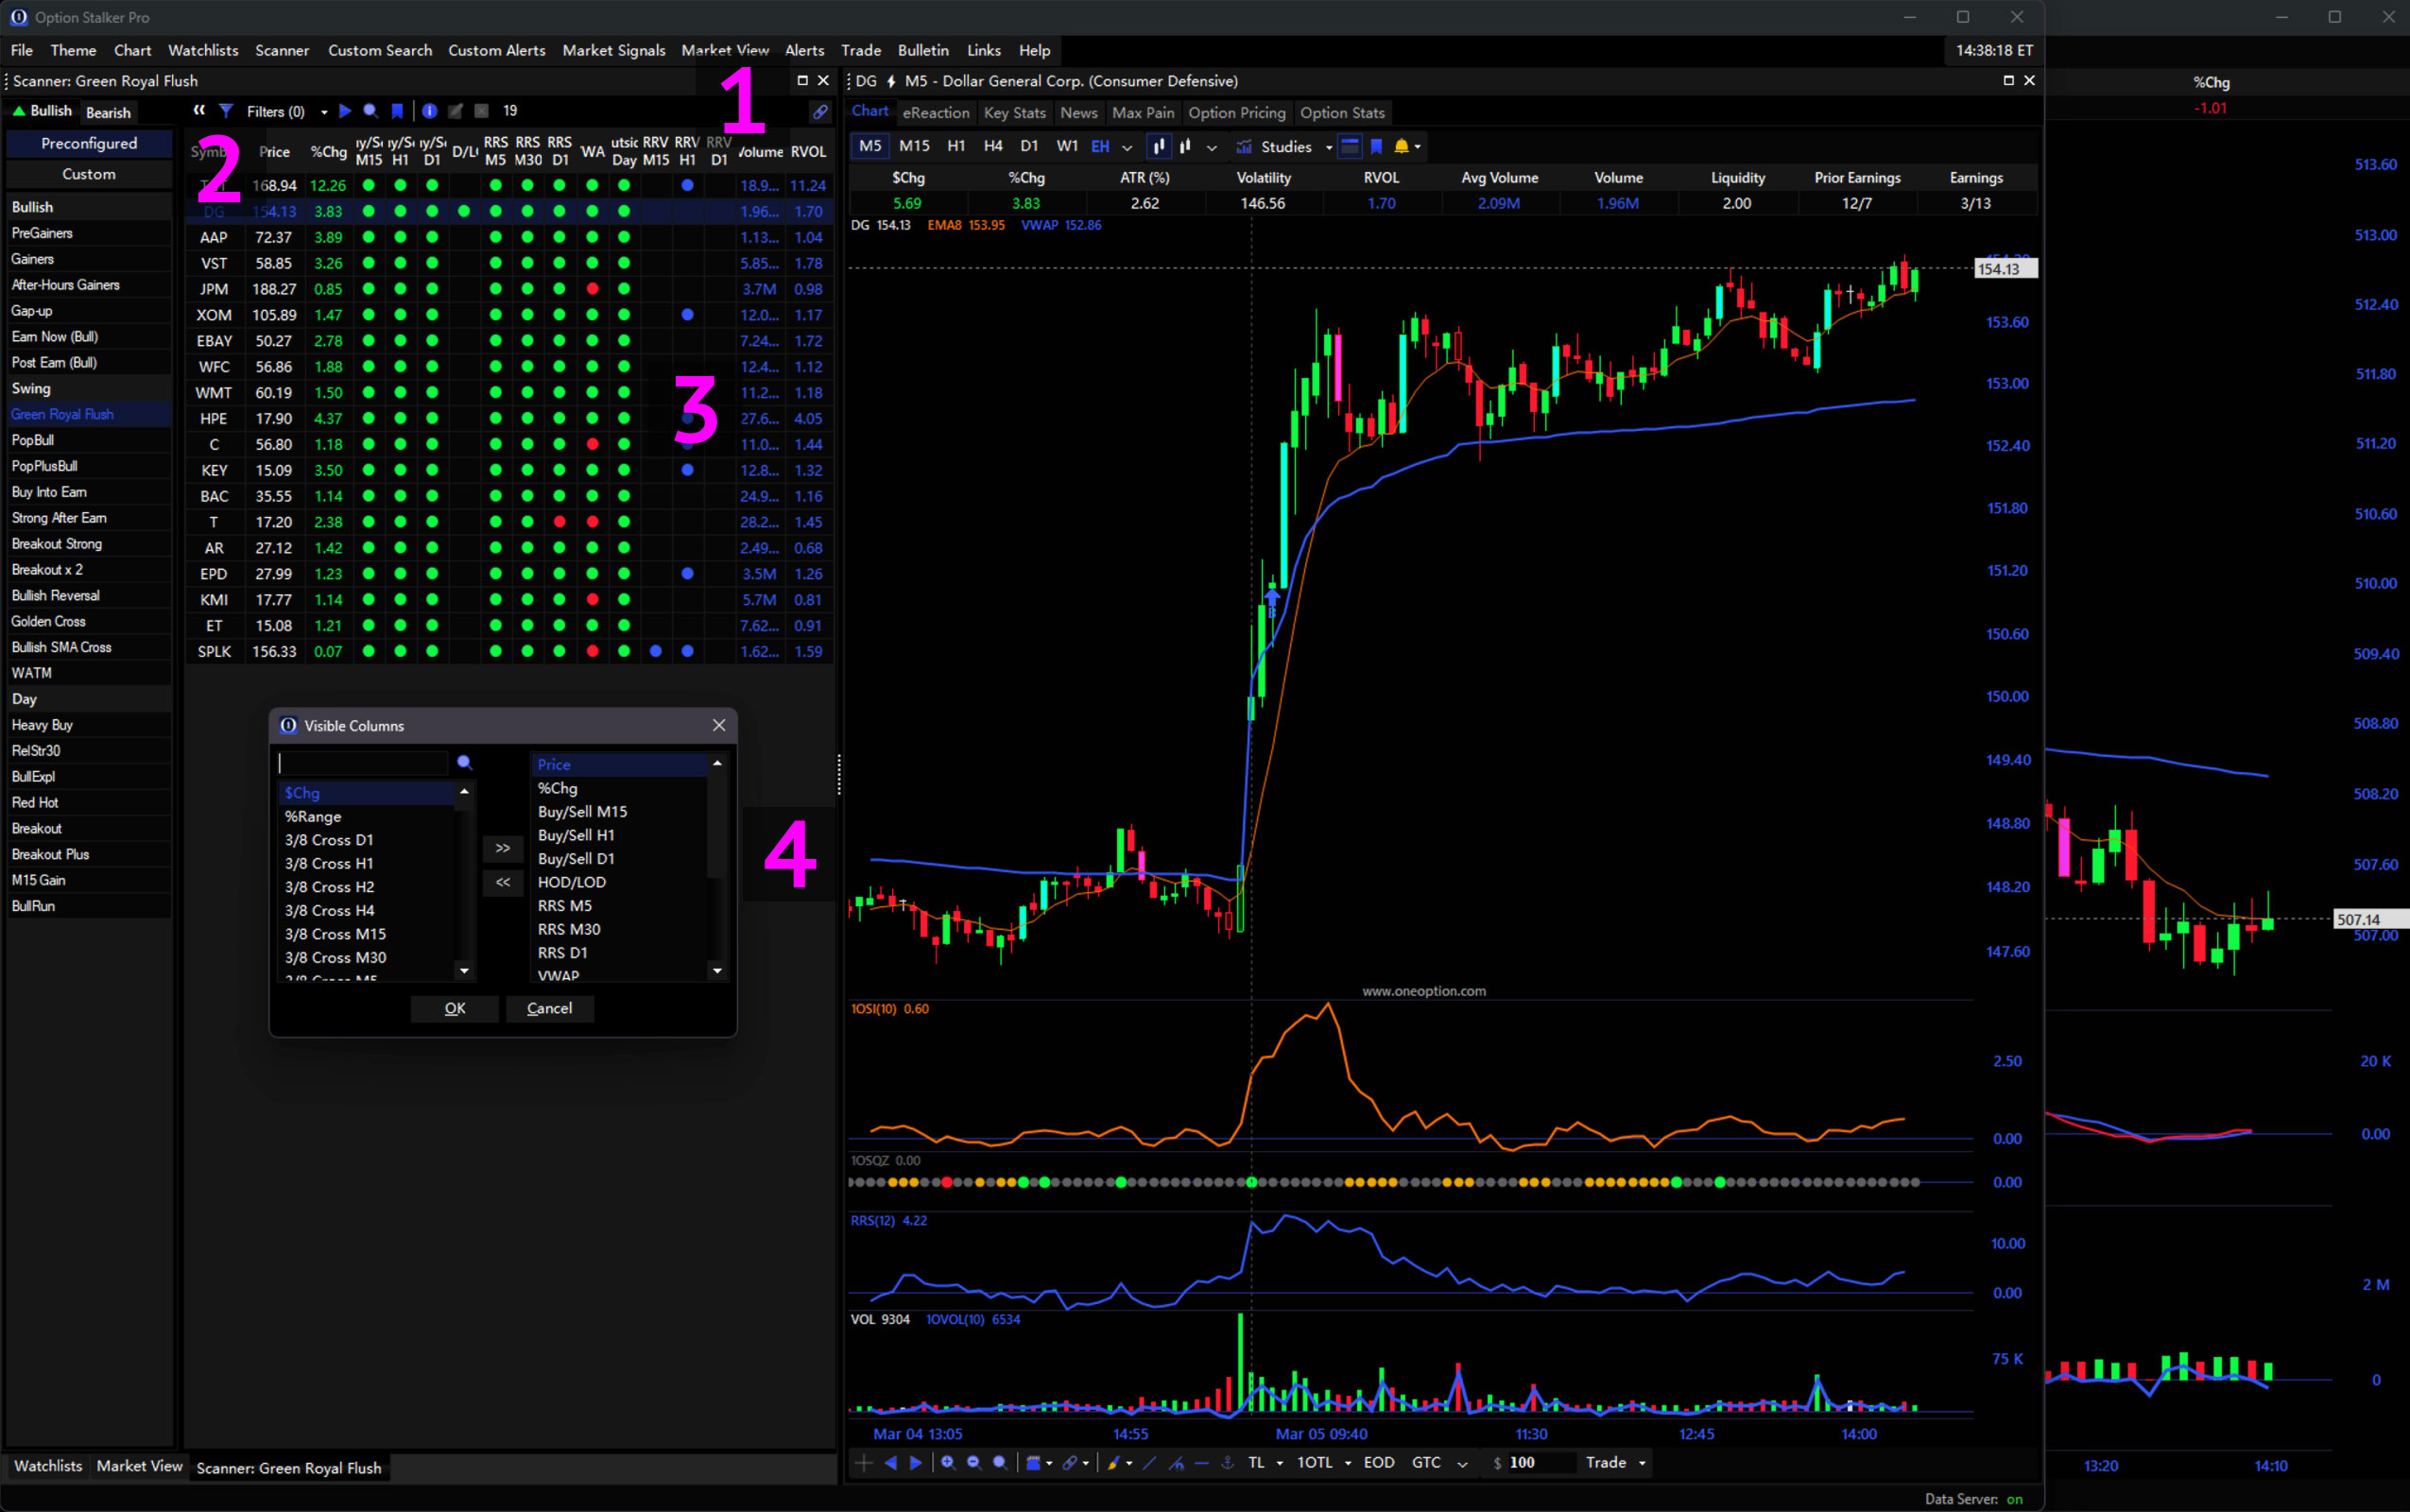
List Columns
List columns are customizable to display the variable values used for Alerts and Custom Scanners. Right-Click the table headers in Scanners, Watchlists, and Chart HUDs to edit columns and select Trade Signal (B/S), Strength vs SPY, LRSI and 1OVol for any timeframe and daily SMAs. These columns save with your Workspace and reflect server that refresh every minute. Hover over the column headers and a tooltip will appear describing the column variables.
Customized columns are shown in the Chart HUDs, Scanner, and Watchlist. Use these columns to quickly scan lists of stocks for relevant criteria.
List Alert Creation
Right-Click any chart or table column to quickly create an alert. The New Alert Window will open pre-filled with the clicked symbol and variable. Right-Click the table headers to apply an alert to all symbols in a list.
Right-Click menu showing alert creation options when (1) right-clicking a chart or (2) right-clicking a table cell.
List Filters
List Filters can be selected to refine the results of a watchlist or special list. Click the Filter Dropdown and use the checkboxes to select your desired filters. Only stocks that satisfy the constraints of the selected filters will display in the table.
For more information about filters, please visit the Glossary.
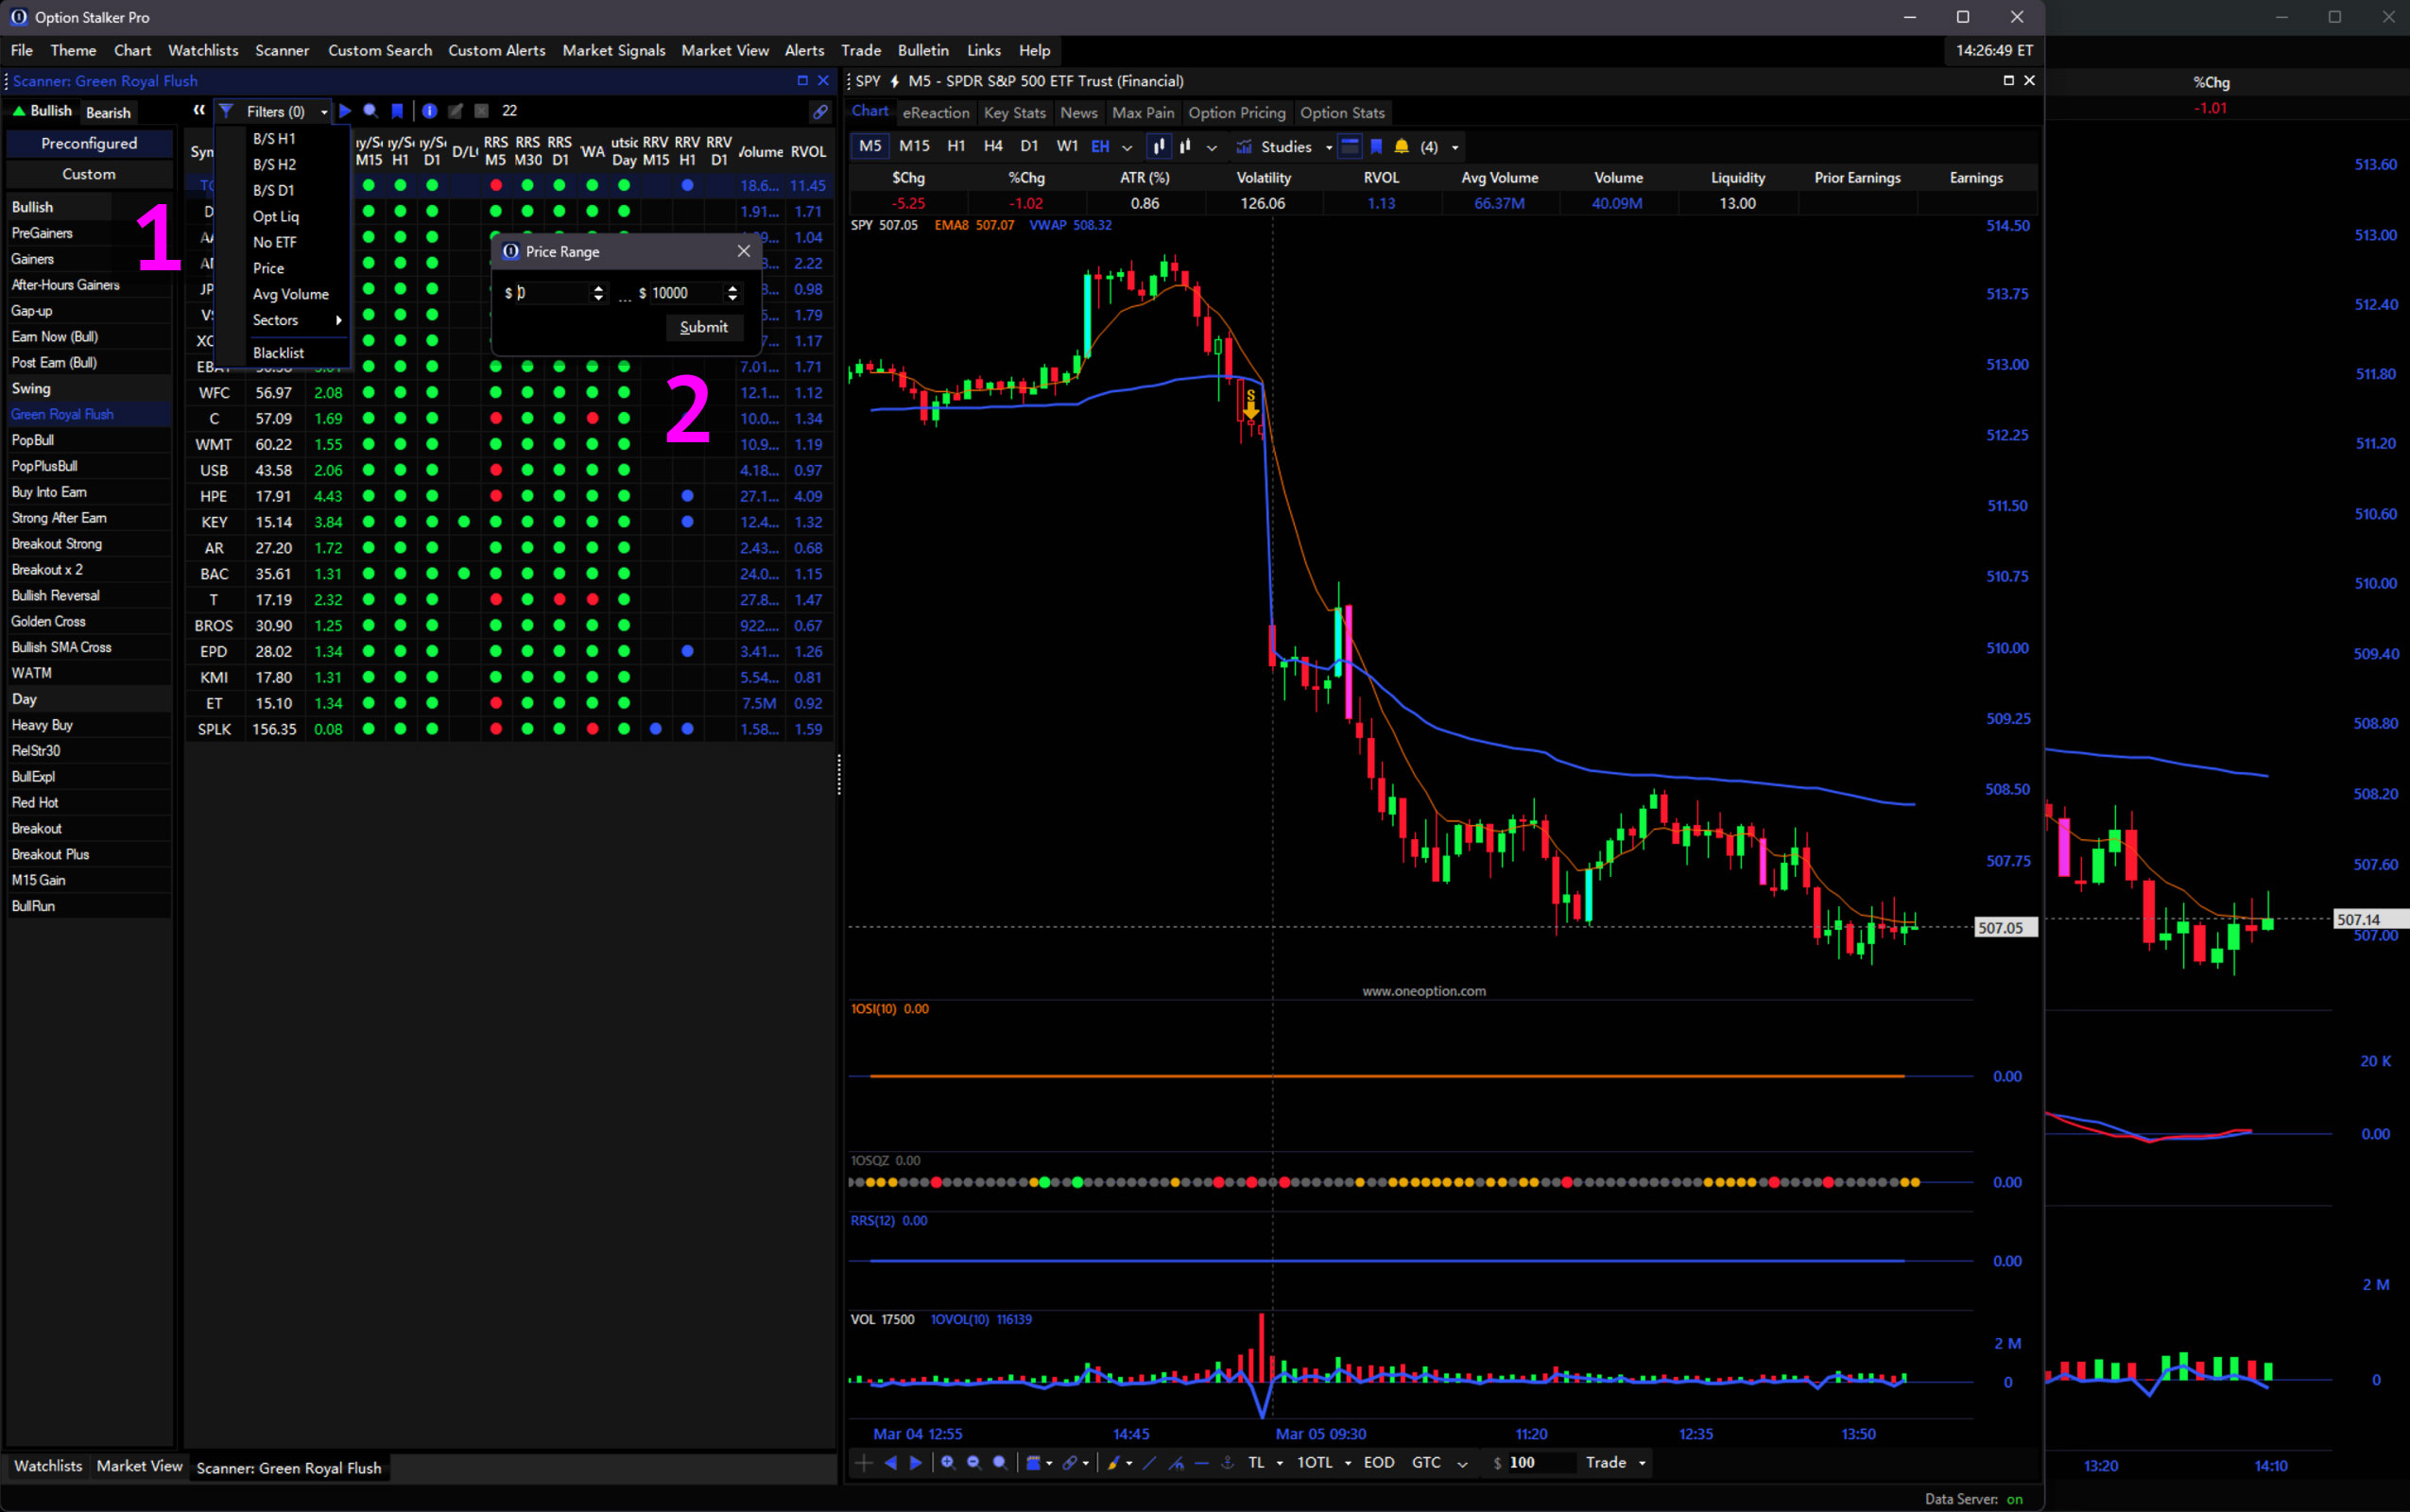
- B/S – Bullish search results must be on a Buy Signal for the marked timeframe (or Sell Signal for Bearish)
- Opt Liq – Results must have an Option Liquidity Rating > 0
- No ETF – Results exclude Exchange Traded Funds (ETFs)
- Price – Stocks within defined price range are included.
- Average Volume – Define a minimum or maximum 20-Day Average Volume.
- Sectors – Reveal stocks within a specific Sector
- Blacklist – Stock symbols included here will be excluded from all lists
Special Lists
Two special lists are included by default with OSP: Tags and Sector ETFs. The Tag list resets each day and can be populated with stocks using the plus (+) icon in the Scanner or List panel headers. The Sector ETF list contains each of the 11 sectors. Each sector can be clicked to reveal its constituent stocks.
Scanner
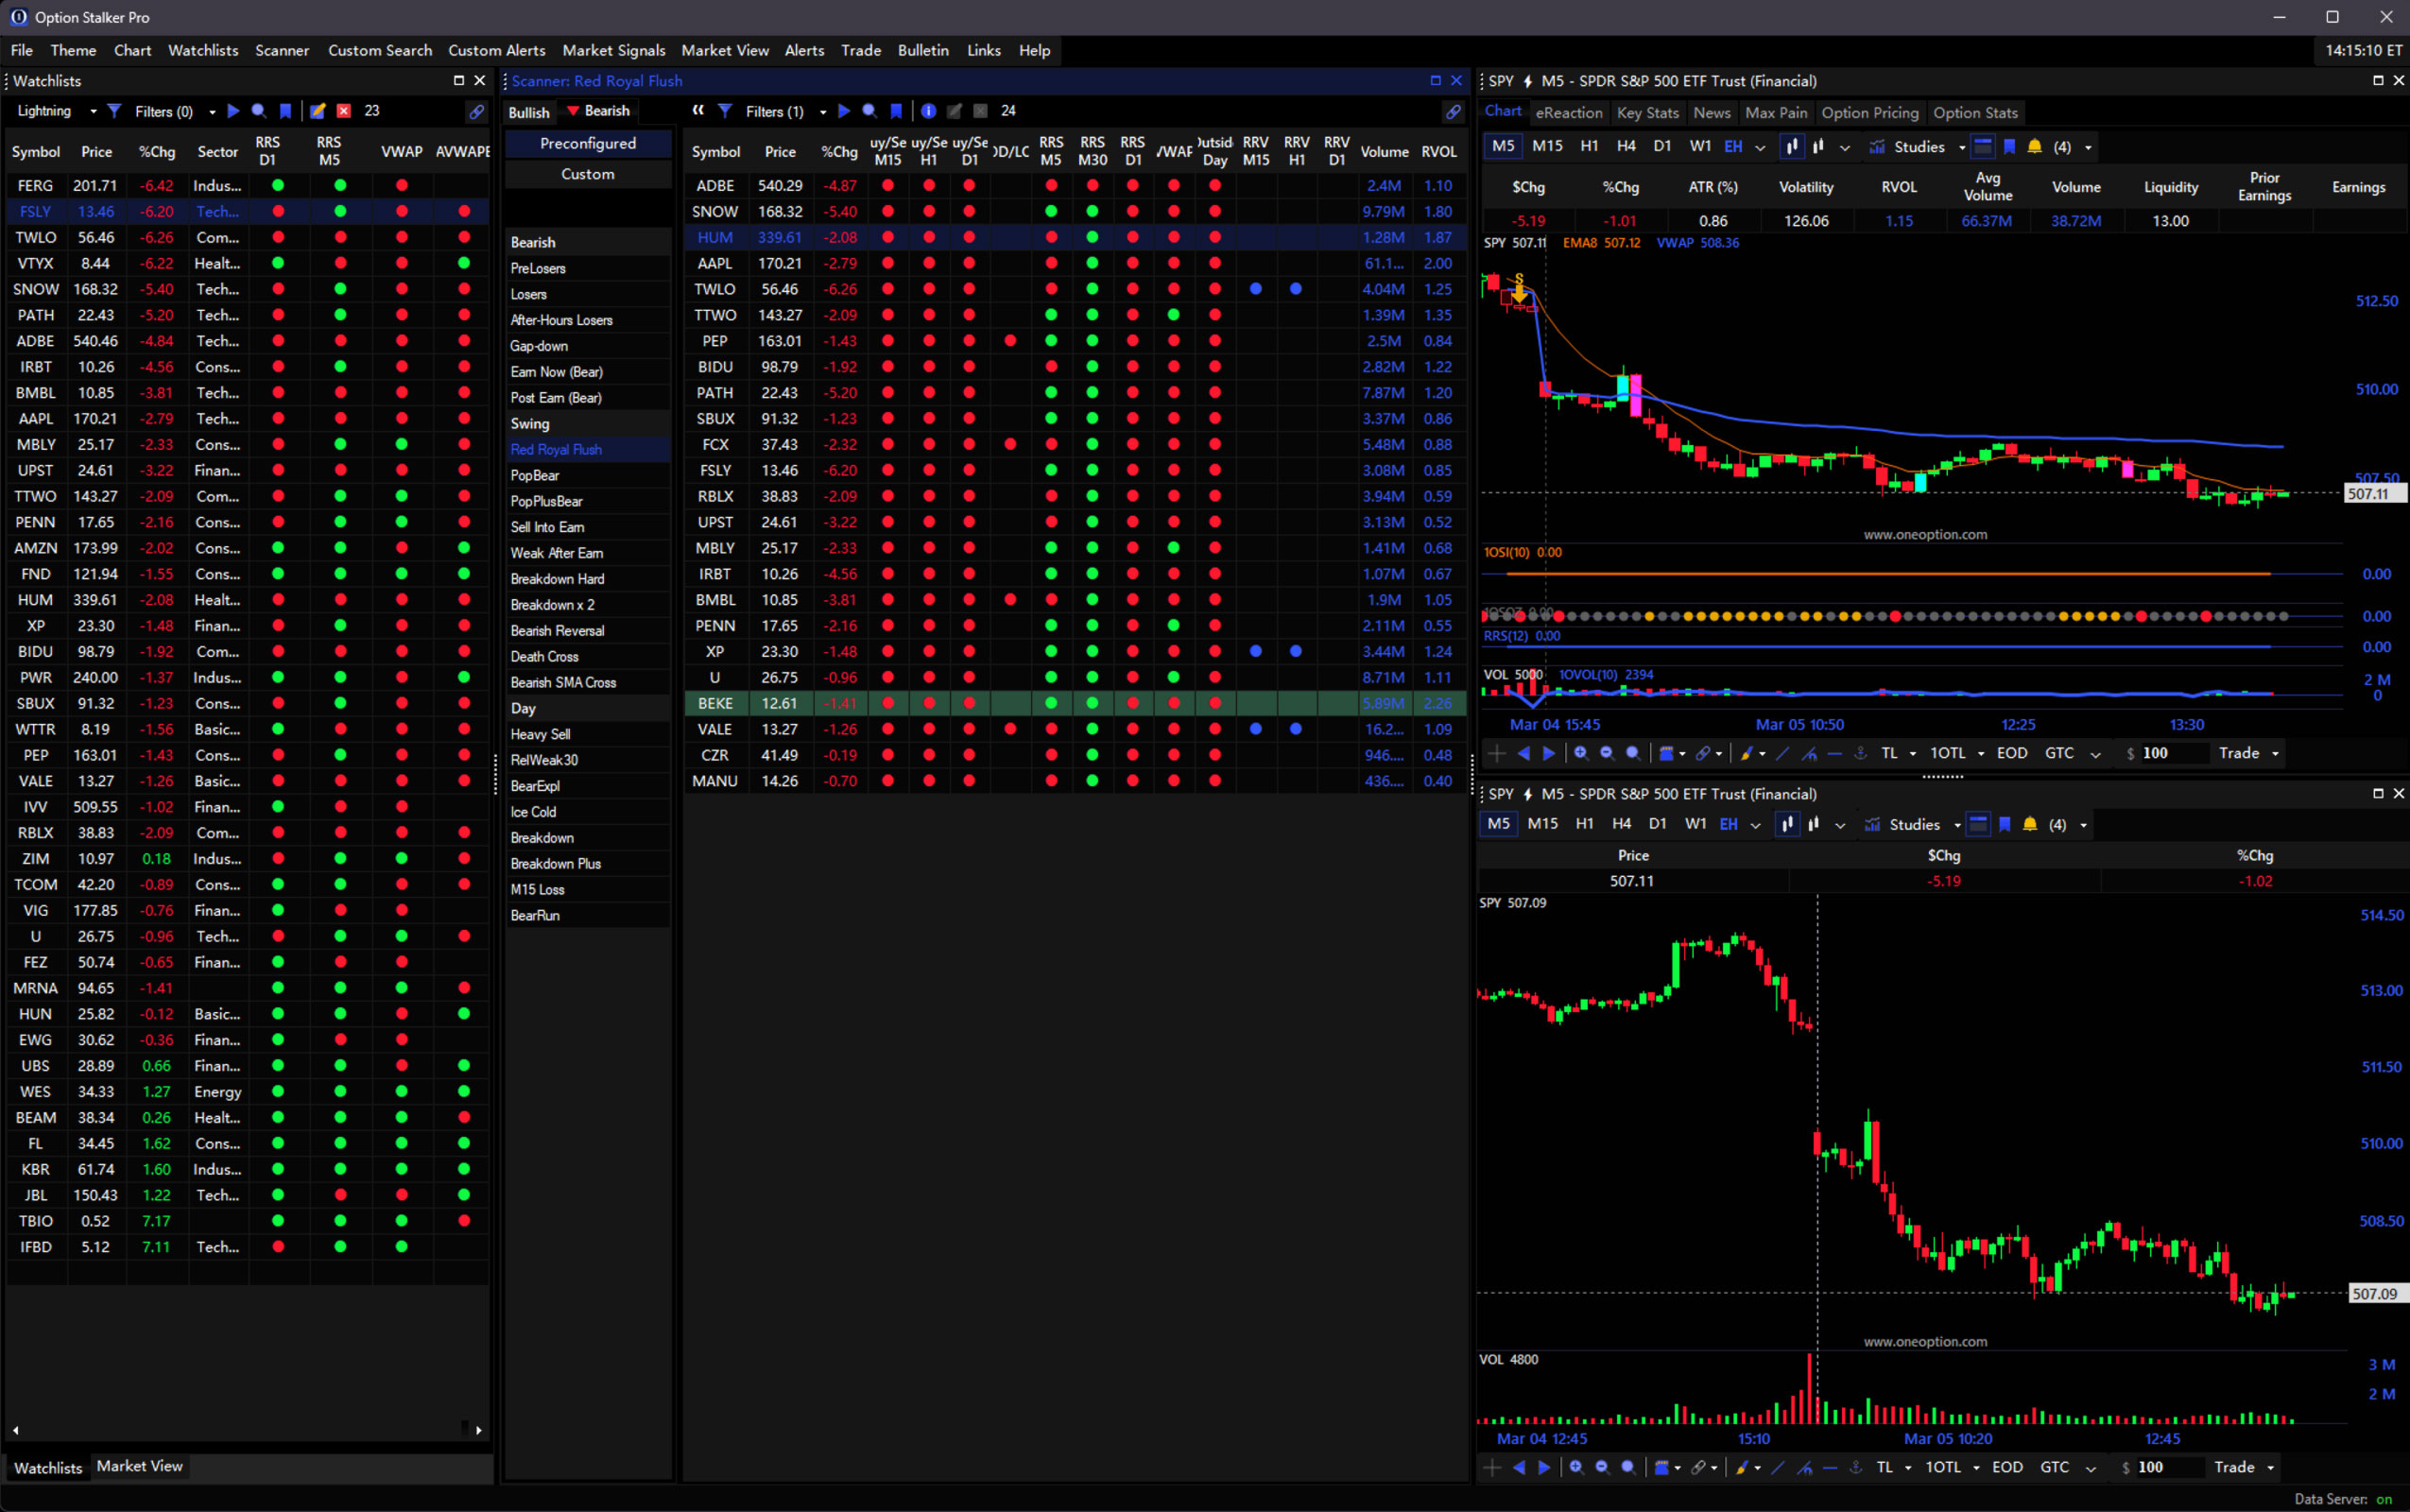
The Scanner panel hosts our favorite Preconfigured Scanners and any Custom Scanners you build using Custom Search and Custom Alerts. Scanners are listed on the left.1 Toggle the tabs at the top to view Bullish or Bearish scanners and select between Preconfigured and Custom scanners.2 When a scanner is selected, results will display in the table on the right.3 Results update continuously during market hours. Right-Click the results table to adjust visible columns.
Preconfigured Scanners
The Preconfigured Scanners included with OSP are the result of years of research and refinement. They are separated into three categories: The first set of searches are generic, but powerful. They are simply called Bullish and Bearish are offer the solid foundation for finding stocks with Relative Strength/Weakness. The Swing section is intended for swing traders who have a 3-4 week time horizon or for day traders who prefer to trade stocks with directional support on higher-time-frames. The Day section uses shorter term search variables to identify short term momentum.
Please refer to the Glossary for a detailed description of each preconfigured scanner.
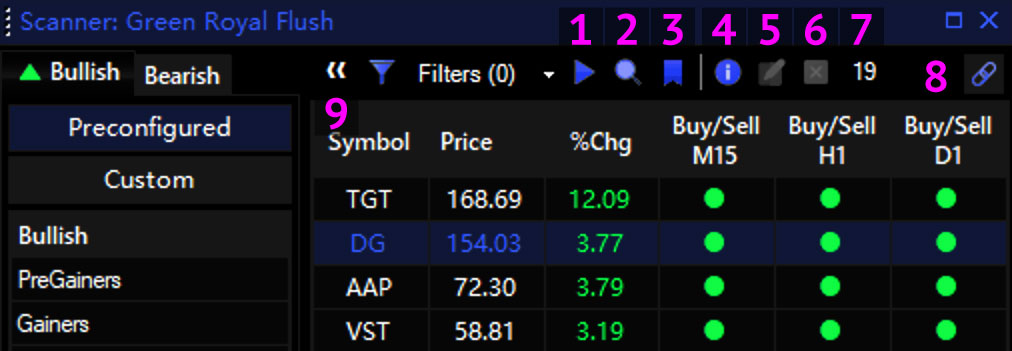
Scanner Header
The Scanner Header is similar to the Watchlist Header in that it contains Filters, Auto-flip1, Symbol search/lookup2, Tagging3, Edit5, Remove6, and Linking8 buttons, along with a counter7. Additionally, the Scanner Header includes a Info button4 to view a scanner description. The list section can be hidden using the Collapse button.9
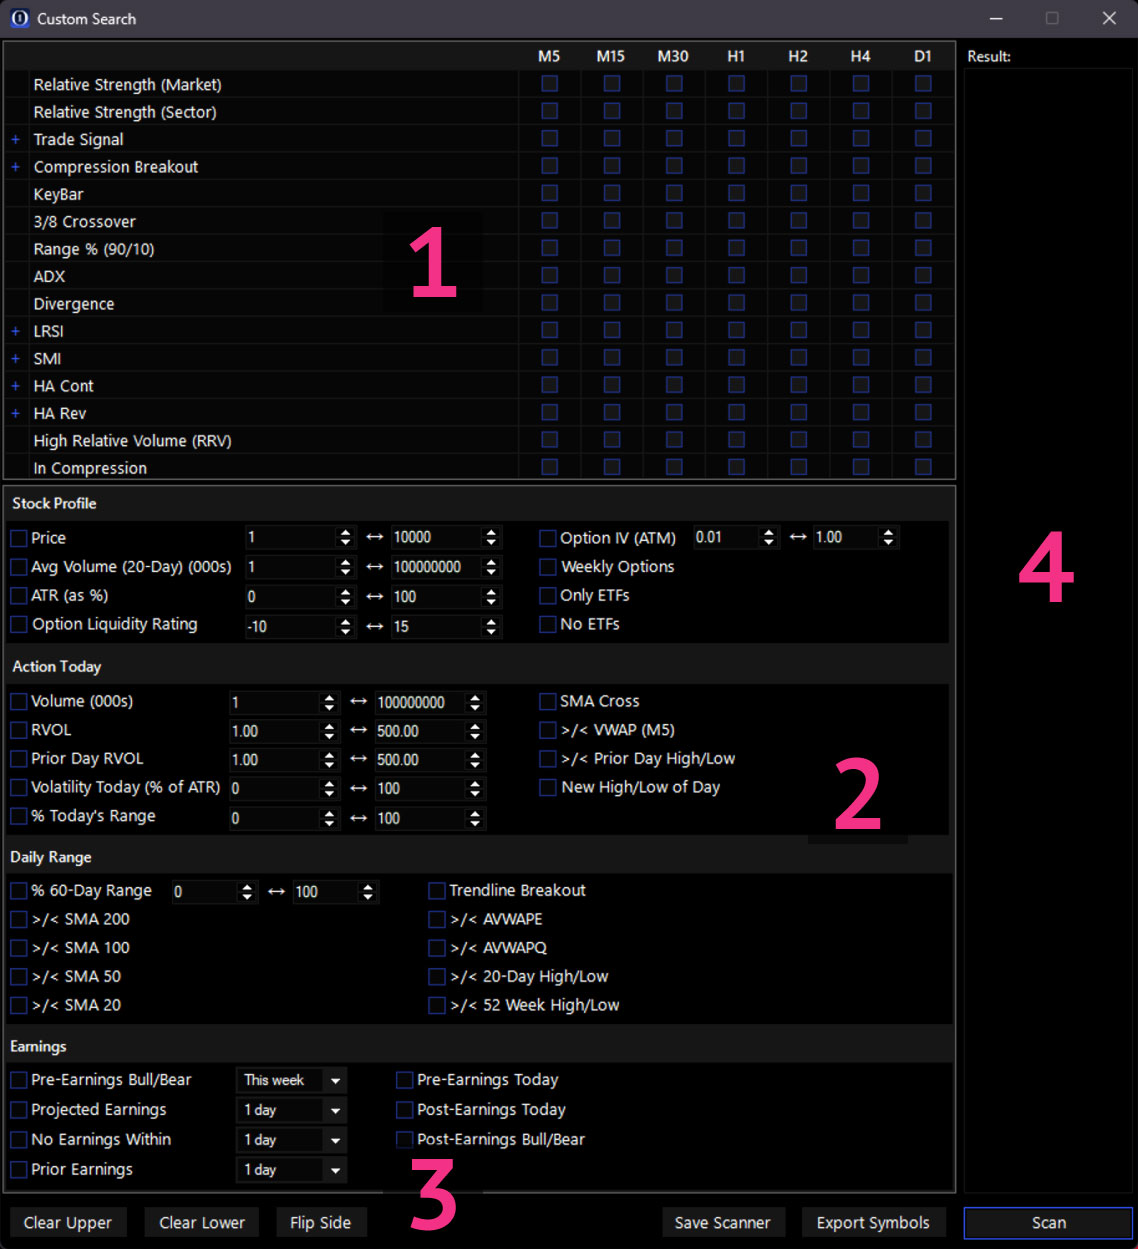
Custom Search
You can build your own Scanners using Custom Search, OSP’s powerful stock search engine.1 With Custom Search, you can search for complex criteria such as trendline breaches, compression breakouts, momentum, heavy volume, trade signals, liquid options and relative strength across all timeframes. The design is binary where possible and variables have been optimized for all timeframes. Open the Custom Search window from the main menu.2 When saved, they become Custom Scanners and appear in the Scanner panel under Custom.3
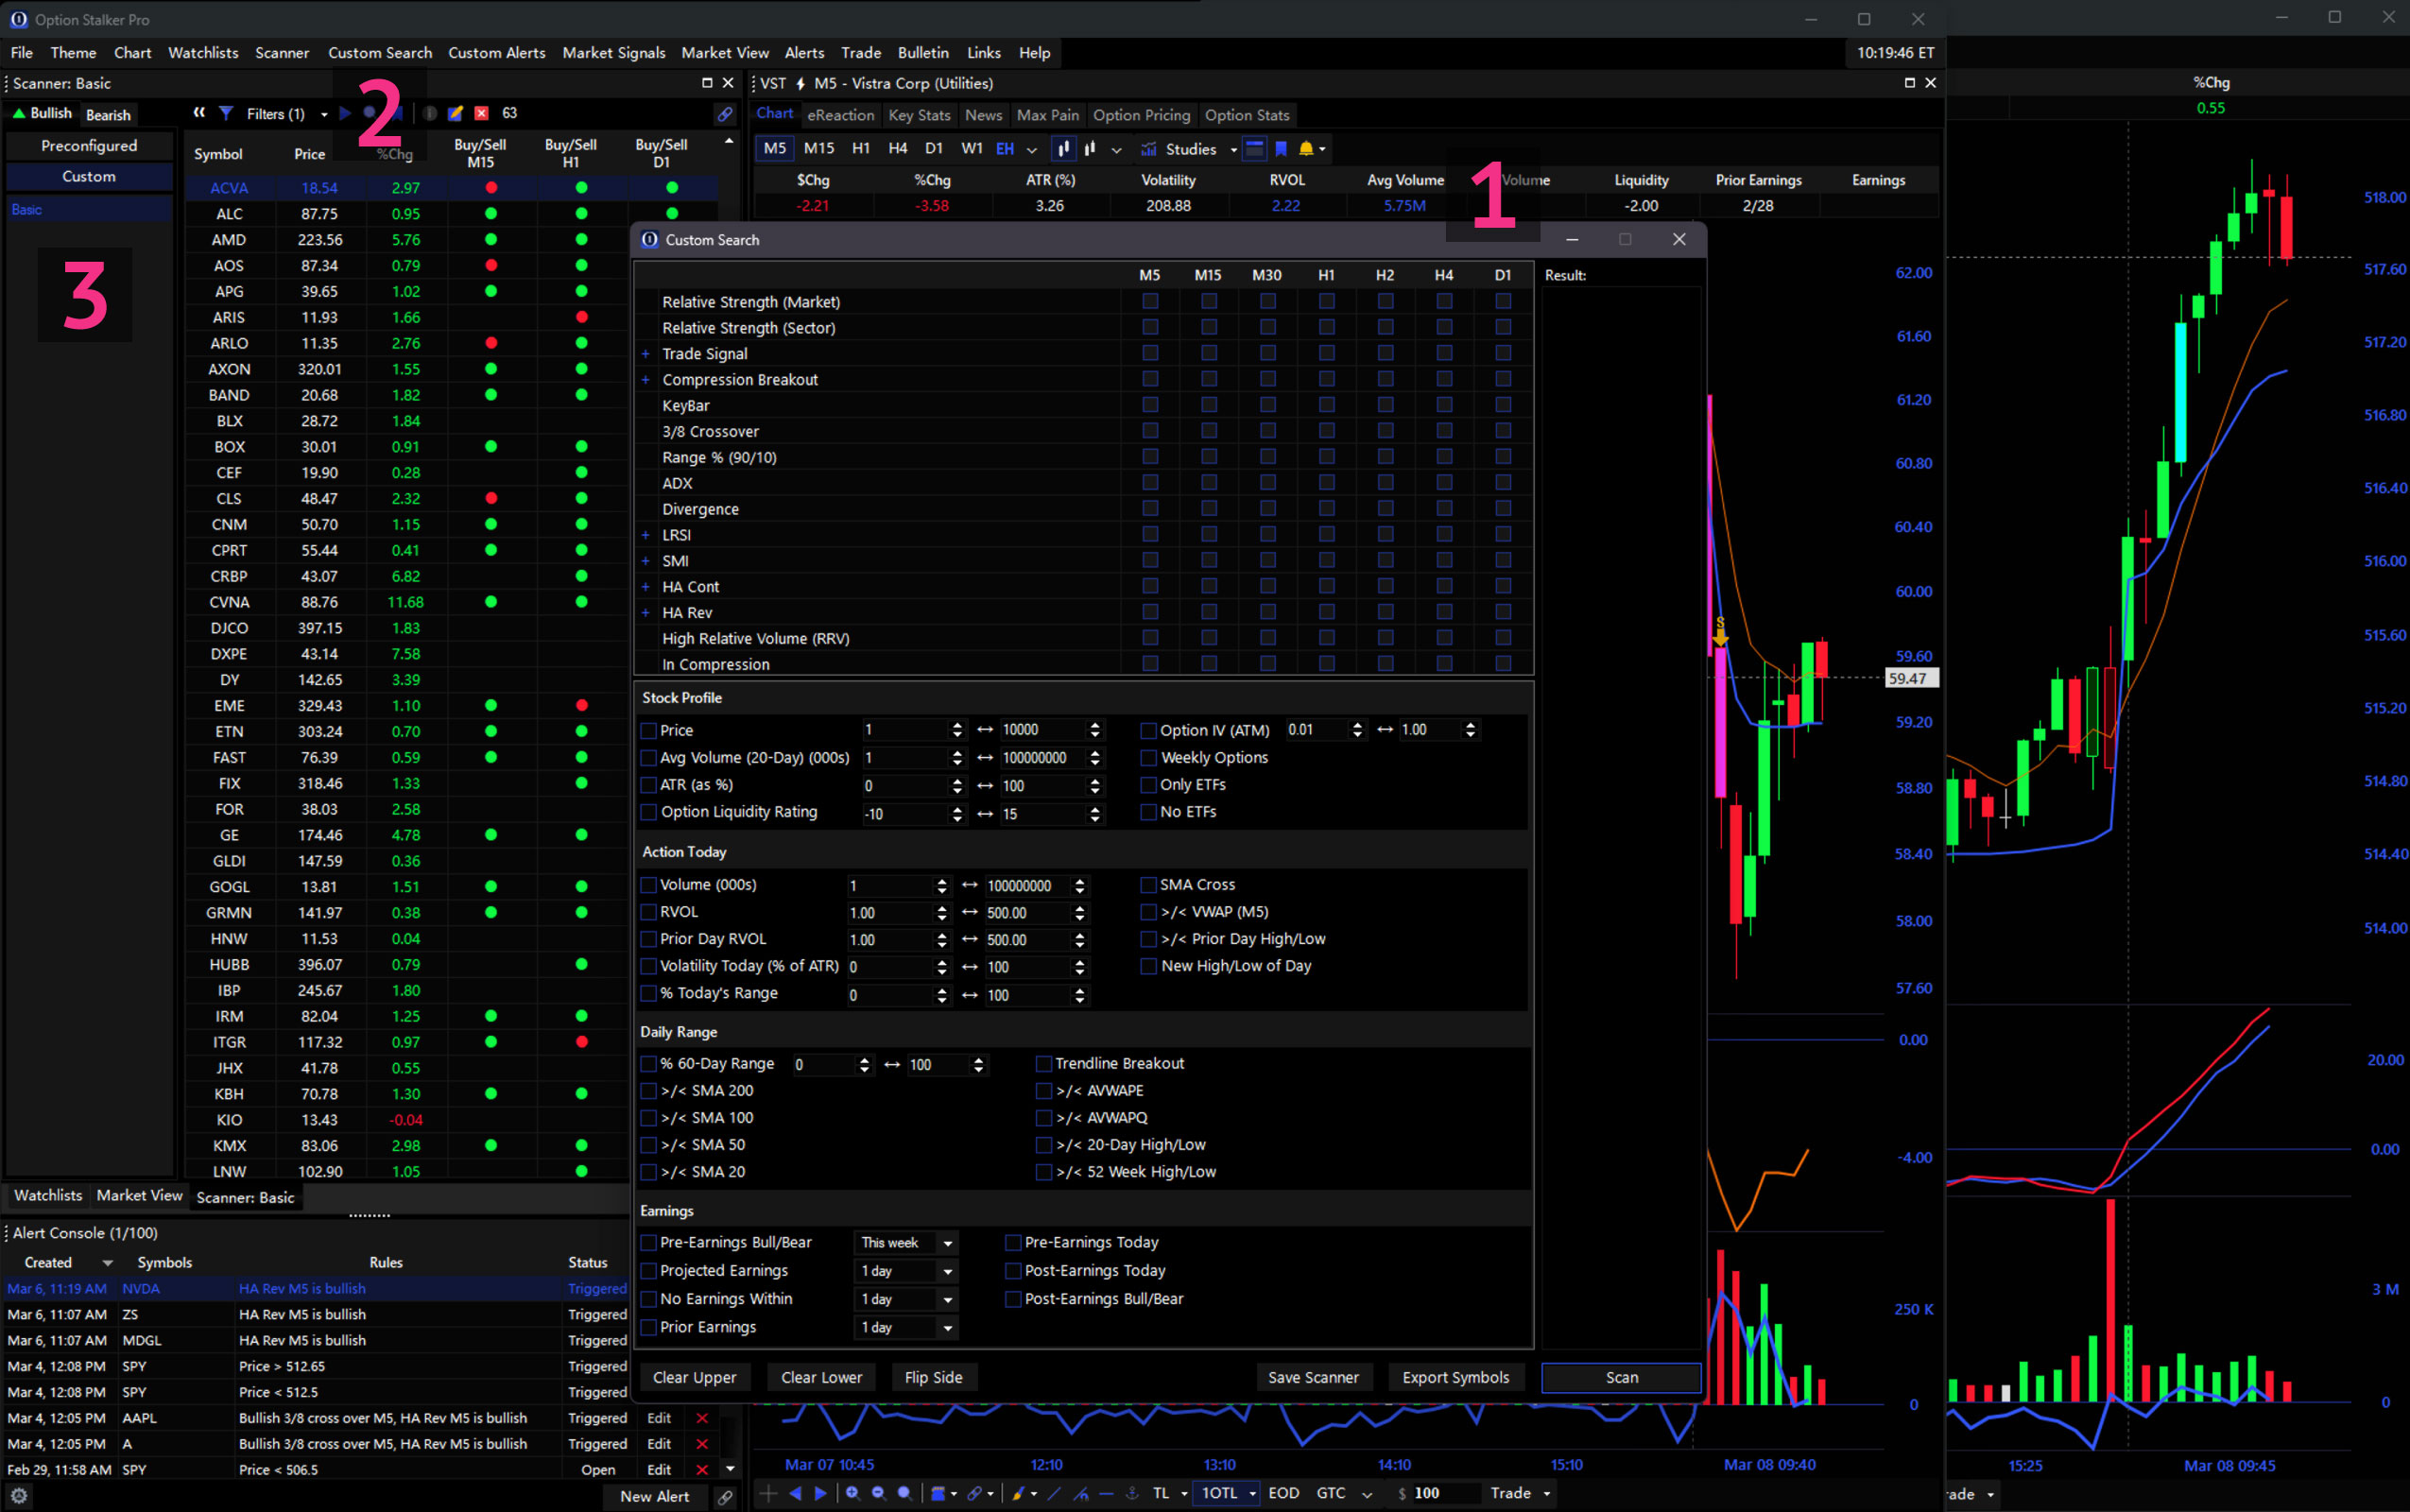
Custom Search Variables
Also referred to as ‘checkboxes’, Custom Search variables are extensive and divided into two sections: Upper & Lower. The upper section consists of timeframe-specific binary variables, and the lower section contains highly customizable variables for further refinement. With these variables, there are nearly limitless combinations that can be used to find top-quality picks in the universe of stocks.
Learn more about each Custom Search variable in our Glossary.
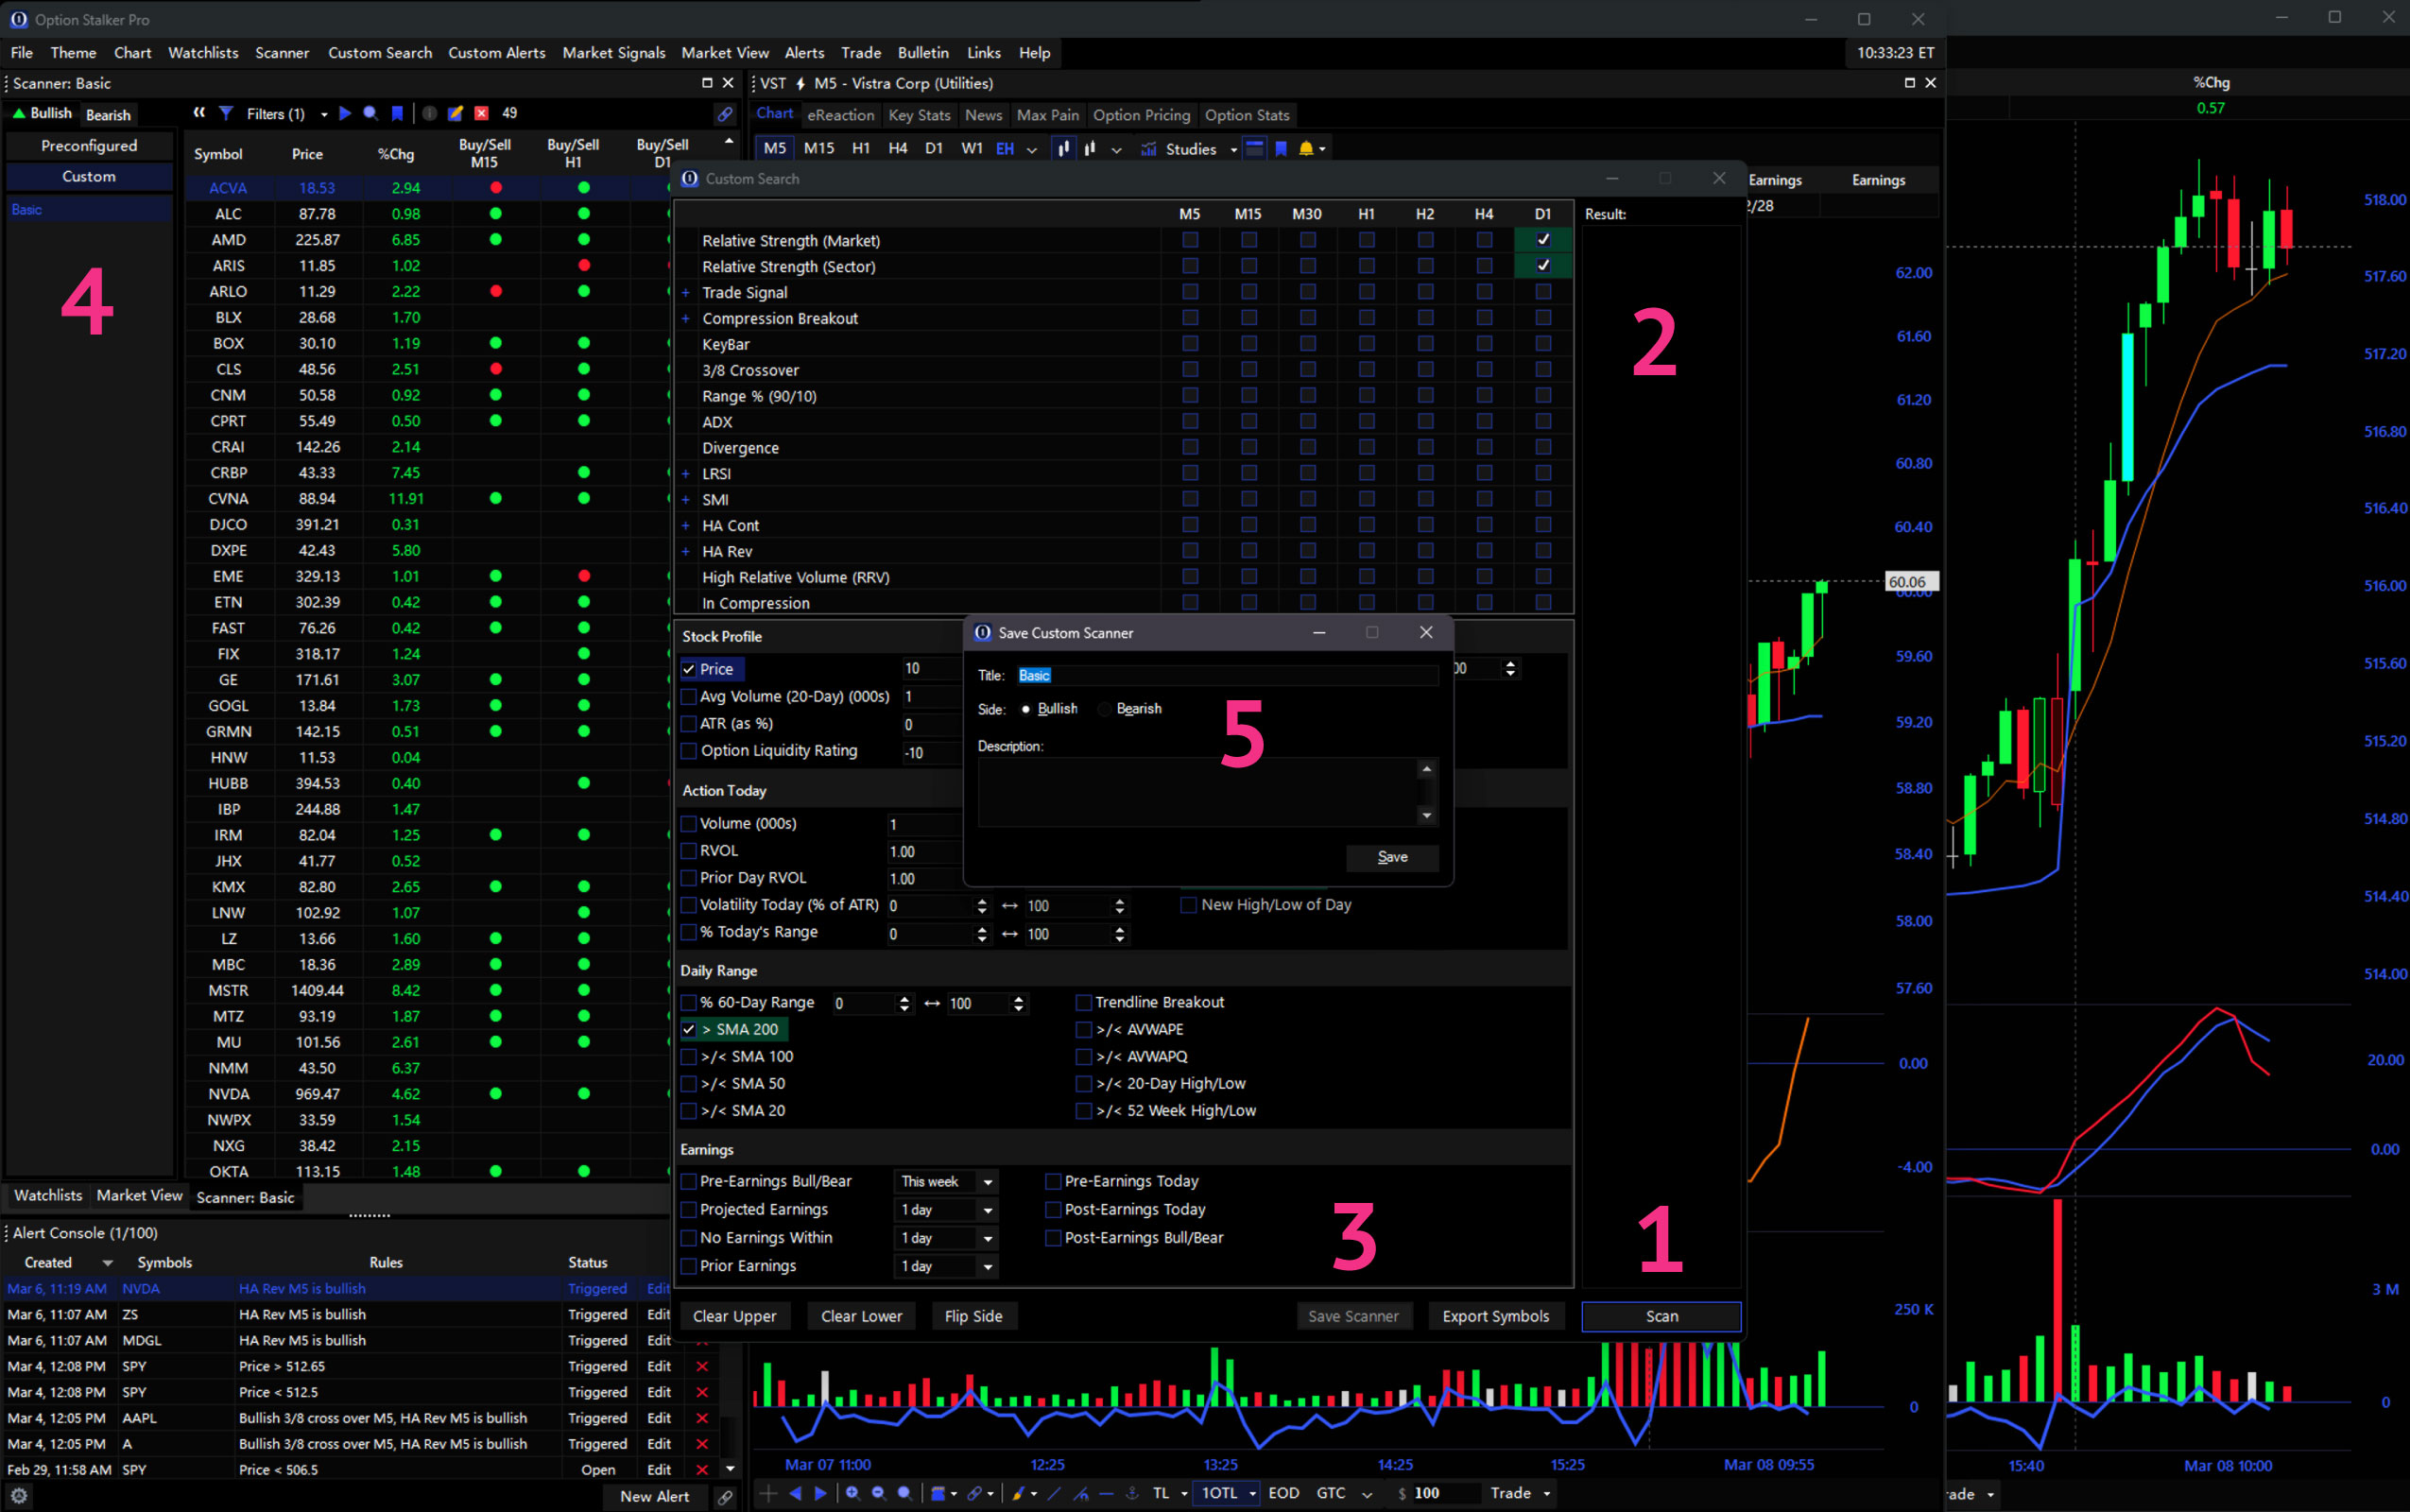
Custom Search Results
After selecting variables for your Custom Search, click the Scan button in the lower-right to see the results.1 A preview will display in the column on the right.2 To save the Custom Search as a Scanner that continually updates, click the Save button on the lower-left.3 When saved, the Custom Scanner will appear in the Scanner panel.4 Name your Custom Scanner clearly so it is easily identifiable in the Scanner panel. Also, designate if the search is bullish or bearish and describe the variables used in the search.5
Alerts
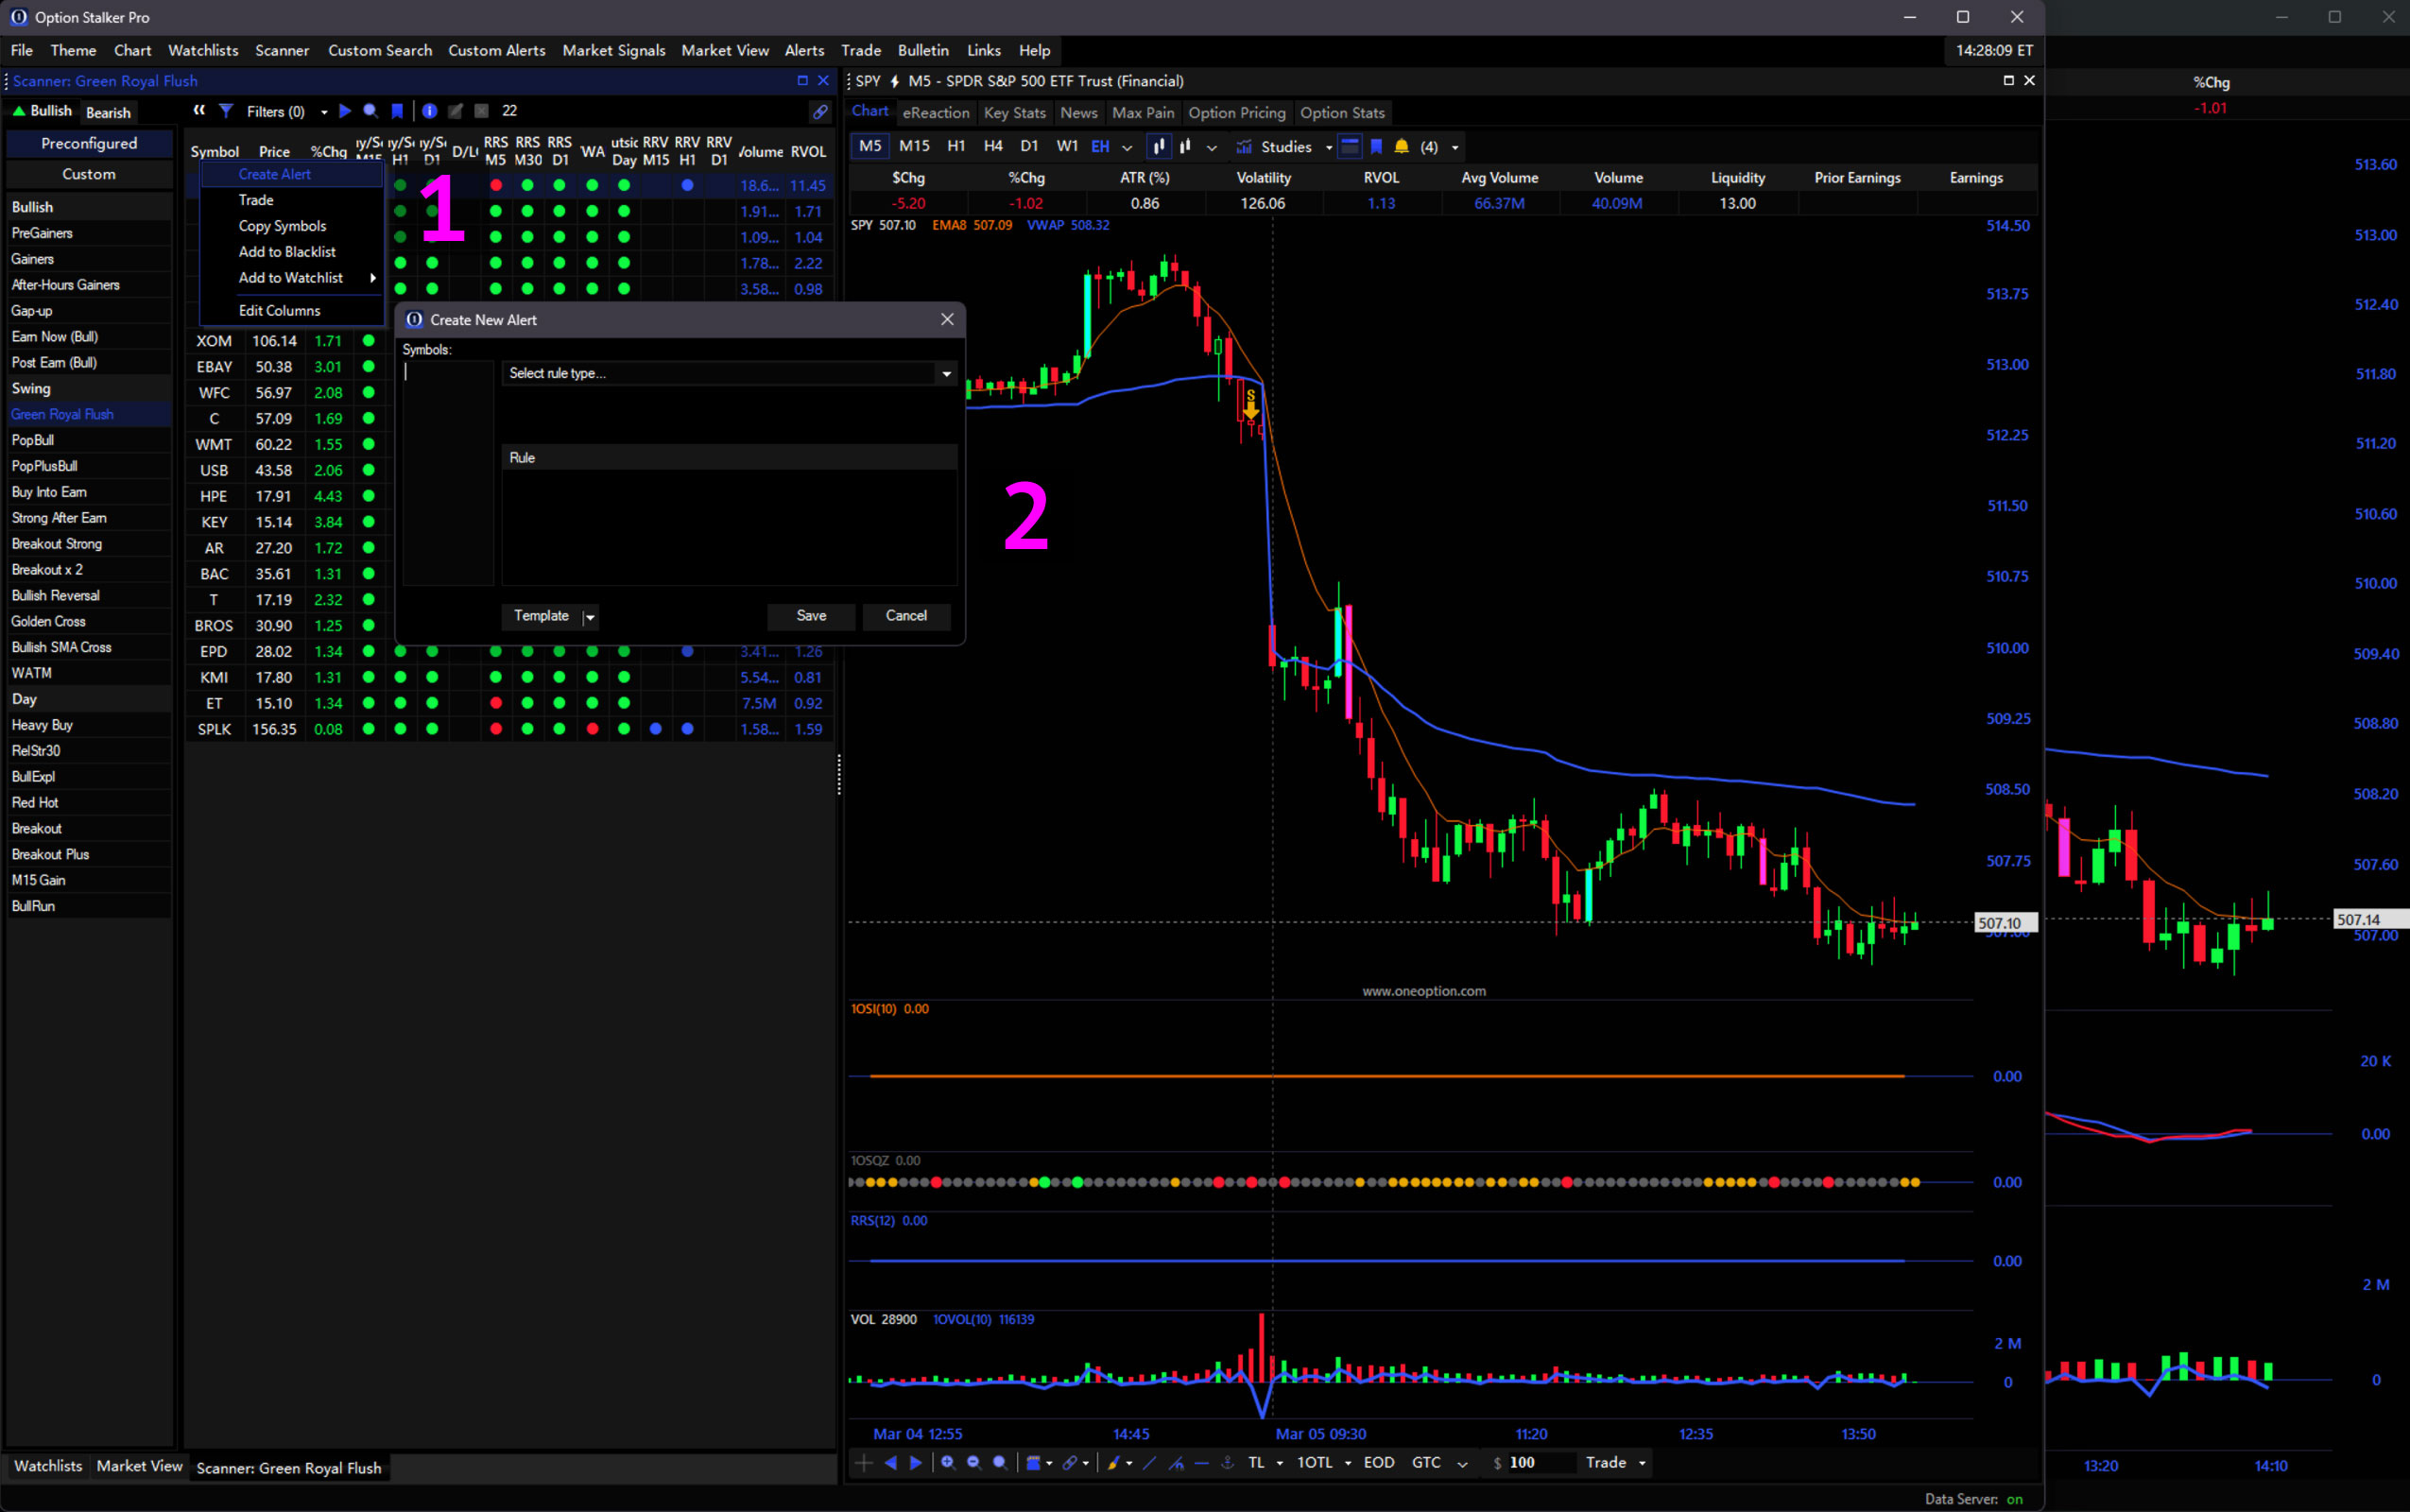
Alerts reflect the same options available in the Custom Scanner and Table Columns and are a powerful feature to improve trade entry and management. Available alerts includes: Relative Strength, ADX, 3/8 EMA Crossover, LRSI, Trade Signal, High Volume, SMAs, VWAP, SMI, Trade Signals, KeyBars, Heikin Ashi Reversals, 1OP Divergence, Cross of HOD/LOD, Compressions Breakouts, In Compression and of course Price Alerts. You can create alerts using any of these values for the entire universe of stocks, using values are calculated on and checked against the server on various timeframes.
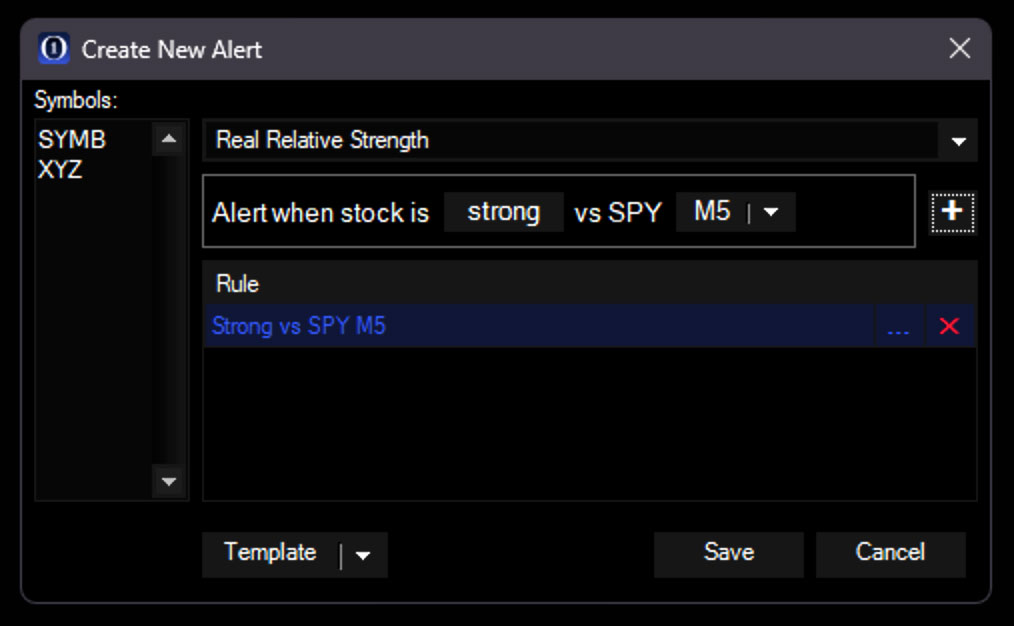
Alerts can quickly be created for more than one symbol. Seen here is the Create New Alert window showing an alert being created for SYMB and XYZ. This alert will trigger when the variable Strength vs SPY goes from < 0 to > 0.
Multi-Rule Alerts
Alerts rules can be combined to create a single alert which triggers only when all the rules are TRUE. This advanced feature allows for fine-tuned alerts enhance your ability to find trades exactly when conditions align.
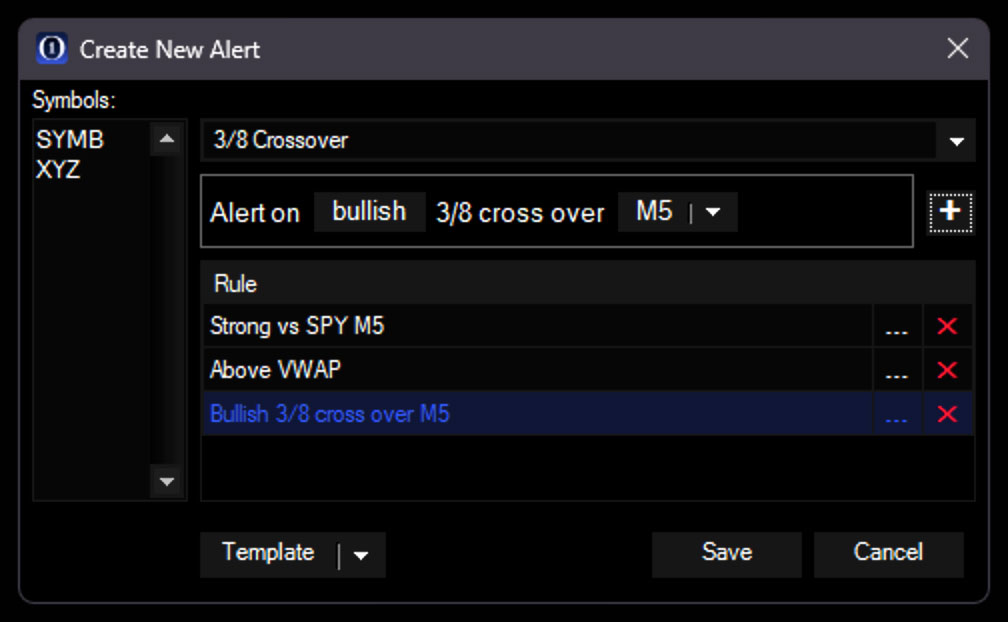
This alert will trigger when SYMB and XYZ is Strong vs SPY on the 5m chart, is above VWAP, and has a bullish 3/8 EMA Cross.
Alert History
With so many alerts, the popups can quickly become an annoyance. Instead, you can now view all your triggered alerts in a single panel. This panel will nest in your Workspace. There is an added benefit to this: Your triggered alert history is now easily visible so you won’t forget alerts that trigger!
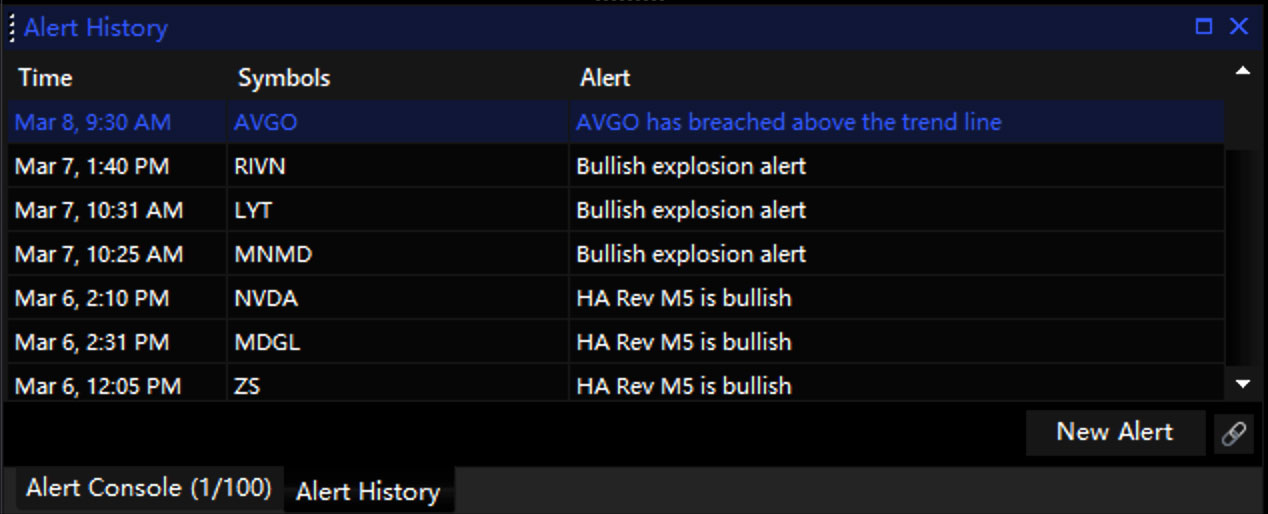
Alert History shows triggered alert history. Click a symbol in this panel to open the chart.
Alert Console
The Alerts Console is a similar list that shows both Triggered and Open alerts. Here, you can Edit and Delete alerts. Right-Click Alert Console table area to remove alerts. You can select multiple rows at once using CTRL or Shift. Click the Settings button to adjust Alert Settings.
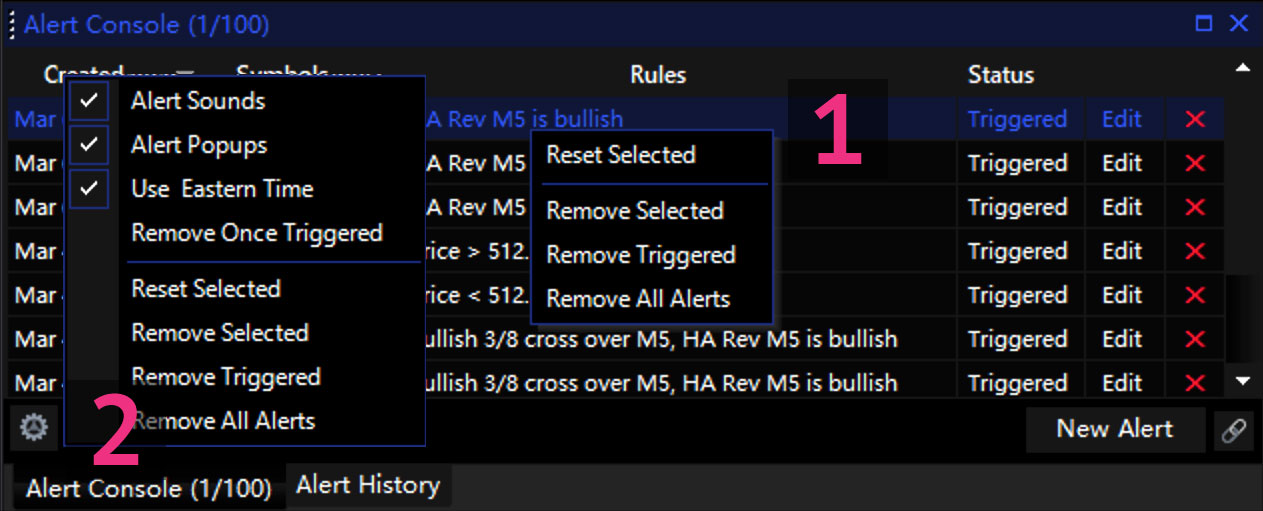
Create, Edit, and Delete alerts in the Alert Console. Columns are resizable, and you can sort the list by clicking Column Headers. (1) Right-Click rows to remove. (2) Use the gear icon to adjust global alert settings.
Push Notifications
Option Stalker Pro can display alerts on mobile and desktop devices using Push Notifications (even when OSP is closed!). It does so using our web app: Option Stalker. Configure push notifications using the following instructions to stay informed with real-time OSP alerts on any device, anywhere.
⚠️ Currently Trendline Alerts (EOD/GTC) are not supported.
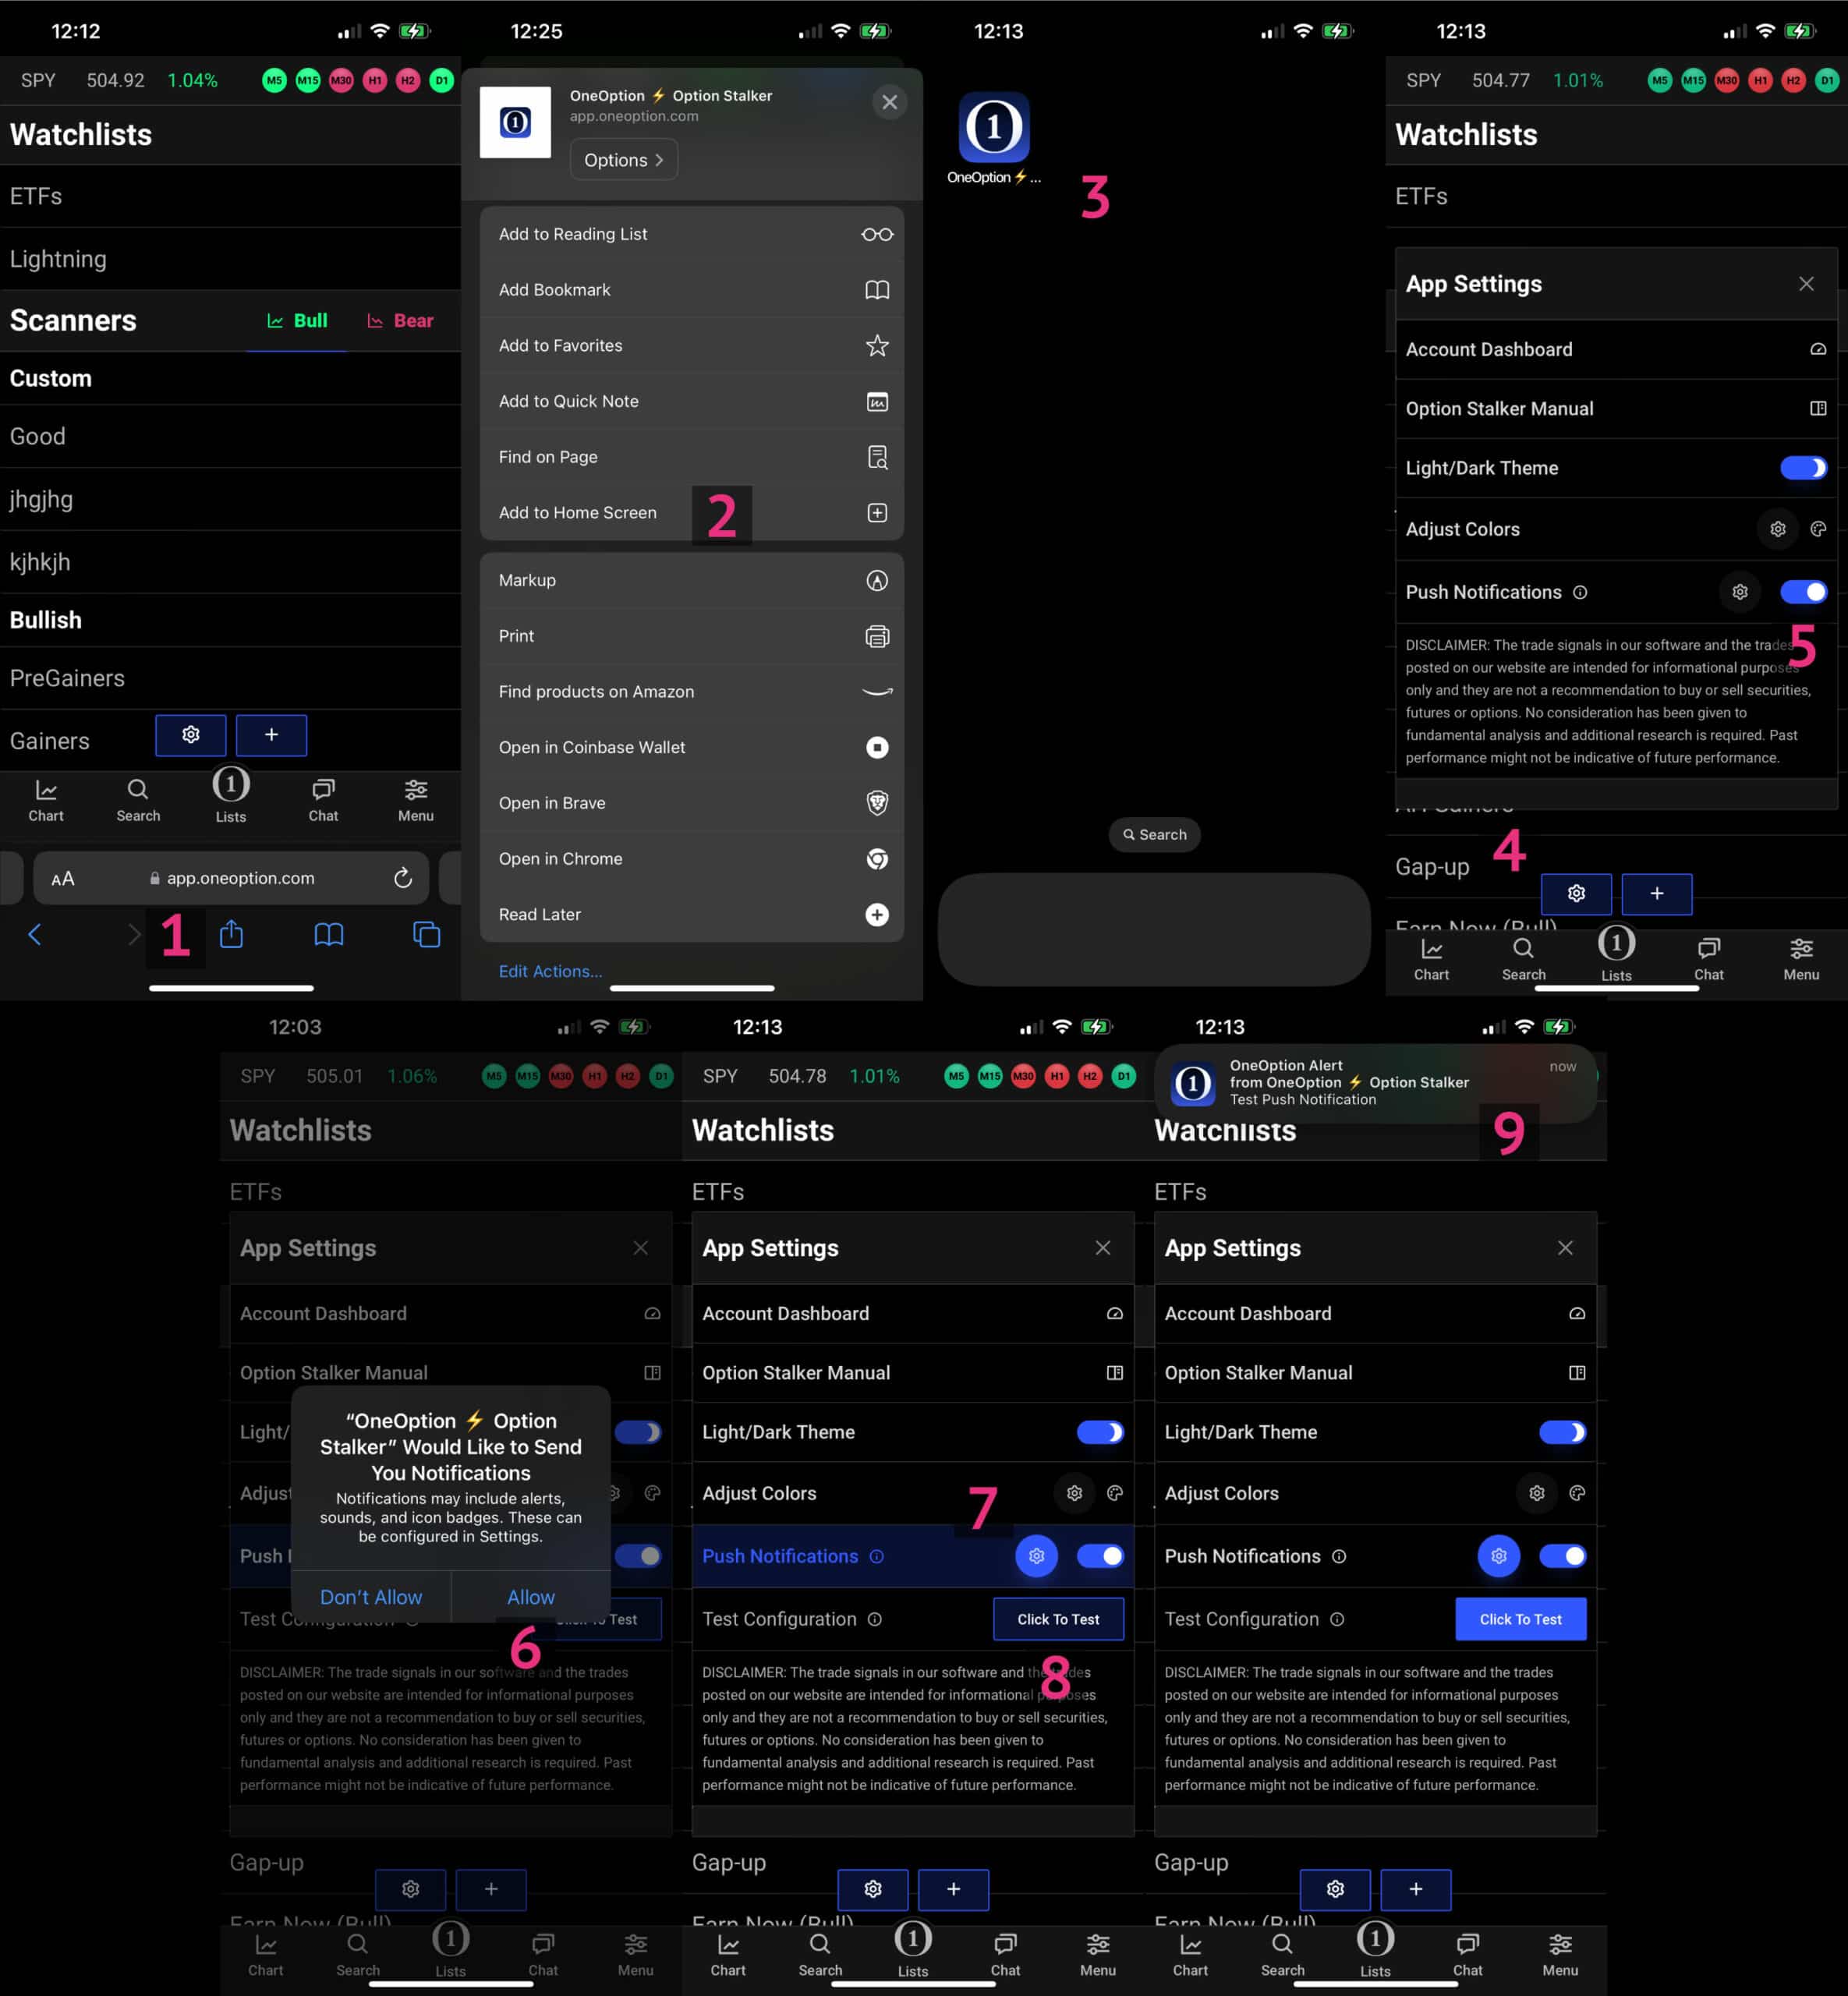
iOS Push Notification Setup (iPhone, iPad)
To receive push notifications on iOS devices such as an iPhone, iPad, or Watch, add Option Stalker web app to your iOS home screen and follow these one-time steps:
⚠️ Older iOS devices first need to Enable Push API on Safari:
1. Go to Settings and then scroll down to Safari.
2. Click Advanced and then Experimental Features
3. The reader has to switch on the Push API toggle.
- Using Safari, open Option Stalker [https://app.oneoption.com/option-stalker] on your iPhone or iPad.
- Click the Share button
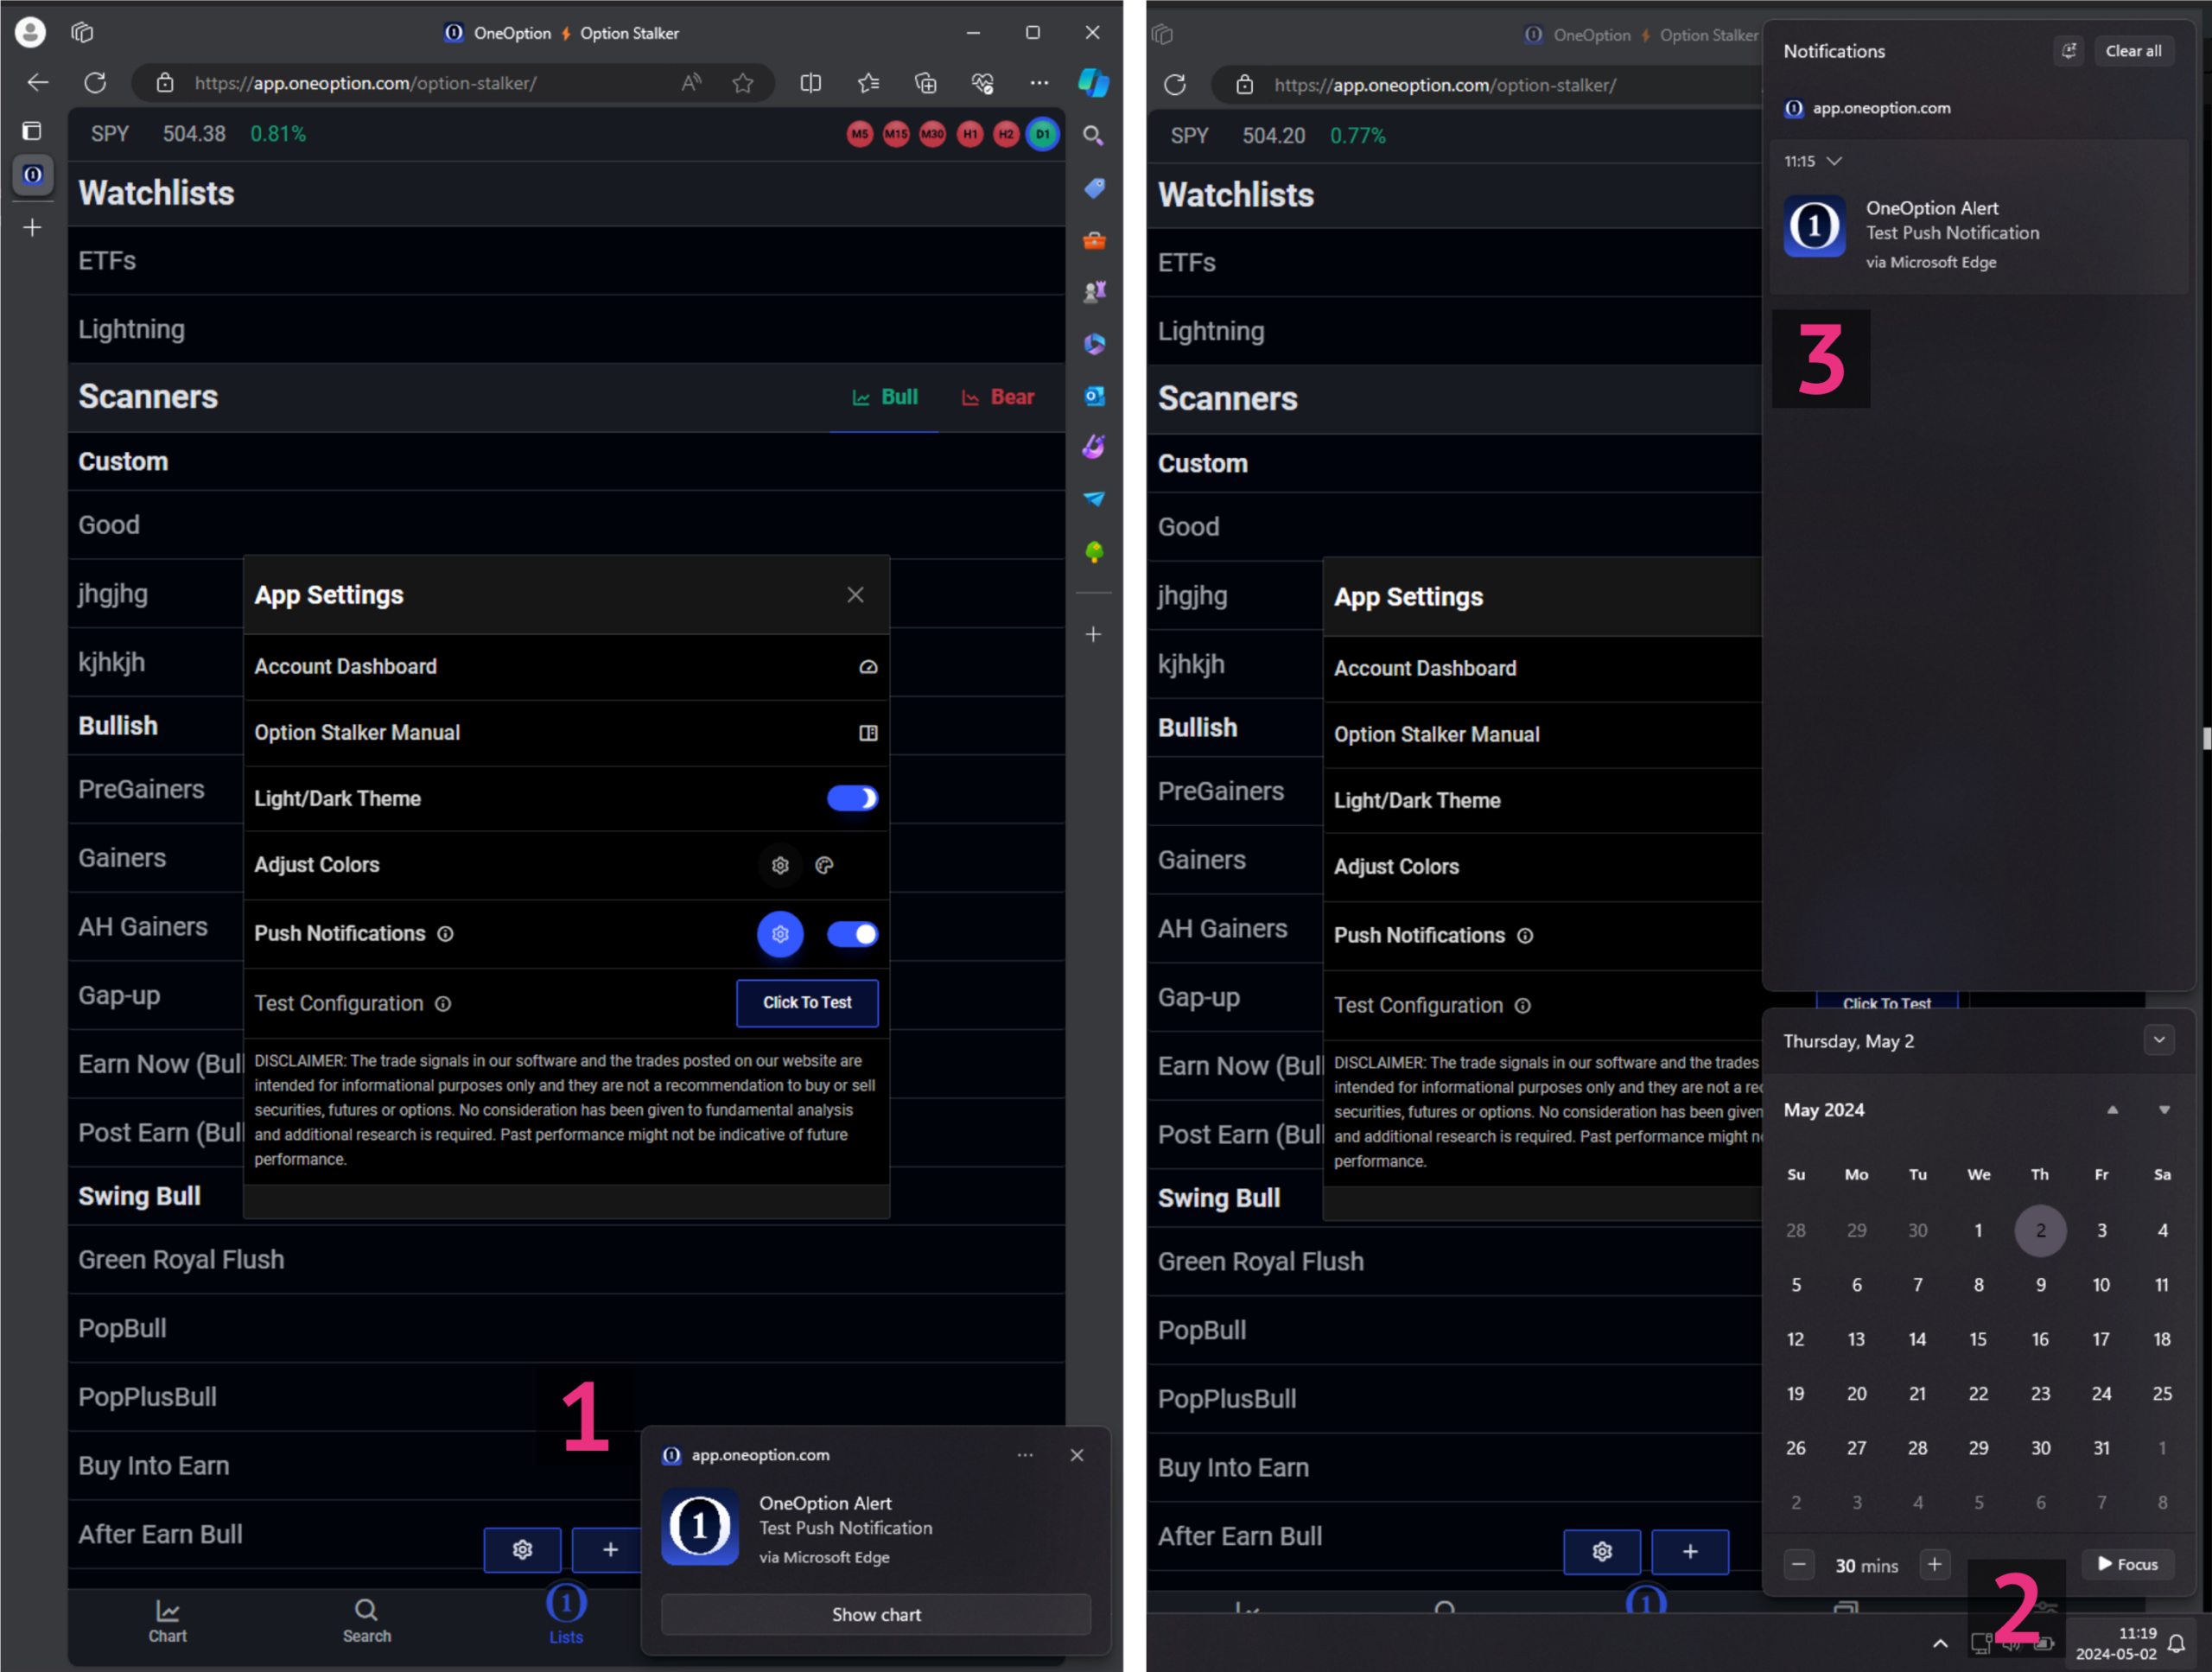
1and scroll down to click Add to home screen2. This will save the app to your device home screen. - With Option Stalker on your home screen, click it to access the web app
3. - From the OS web app home page (where your Watchlists and Scanners are listed), click the blue settings button
4(the gear icon). - Turn ON the Push Notifications switch
5. - You will be prompted to allow Option Stalker to send notifications. Click Allow
6. - Push notifications should now work on your iPhone, iPad or other iOS device. Expand the Push Notifications settings using the gear icon
7and click the Click To Test8button to verify. A test push notification should show on your screen9
Android Push Notification Setup
Enabling Push Notifications on Android devices involves similar steps:
- Open a browser and navigate to Option Stalker (web) [https://app.oneoption.com/option-stalker].
- From the OS web app home page (where your Watchlists and Scanners are listed), click the blue settings button (the gear icon).
- Turn ON the Push Notifications switch.
- You will be prompted to allow Option Stalker to send notifications. Click Allow.
- OSP alerts will now display as push notifications from your browser. Expand the Push Notifications settings using the gear icon and click the Click To Test button to verify. A test push notification should show on your screen.
⚠️ Refer to these instructions for more Android-specific details.
Desktop Browser Push Notifications
Enabling Push Notifications on desktop devices involves similar steps:
- Open a browser and navigate to Option Stalker (web) [https://app.oneoption.com/option-stalker].
- From the OS web app home page (where your Watchlists and Scanners are listed), click the blue settings button
1(the gear icon). - Turn ON the Push Notifications switch
2. - You will be prompted to allow Option Stalker to send notifications. Click Allow
3. - OSP alerts will now display as push notifications on your mobile device. Expand the Push Notifications settings using the gear icon and click the Click To Test
4button to verify. A test push notification should show on your screen5
⚠️ Desktop browser push notifications will only appear when the browser is open!

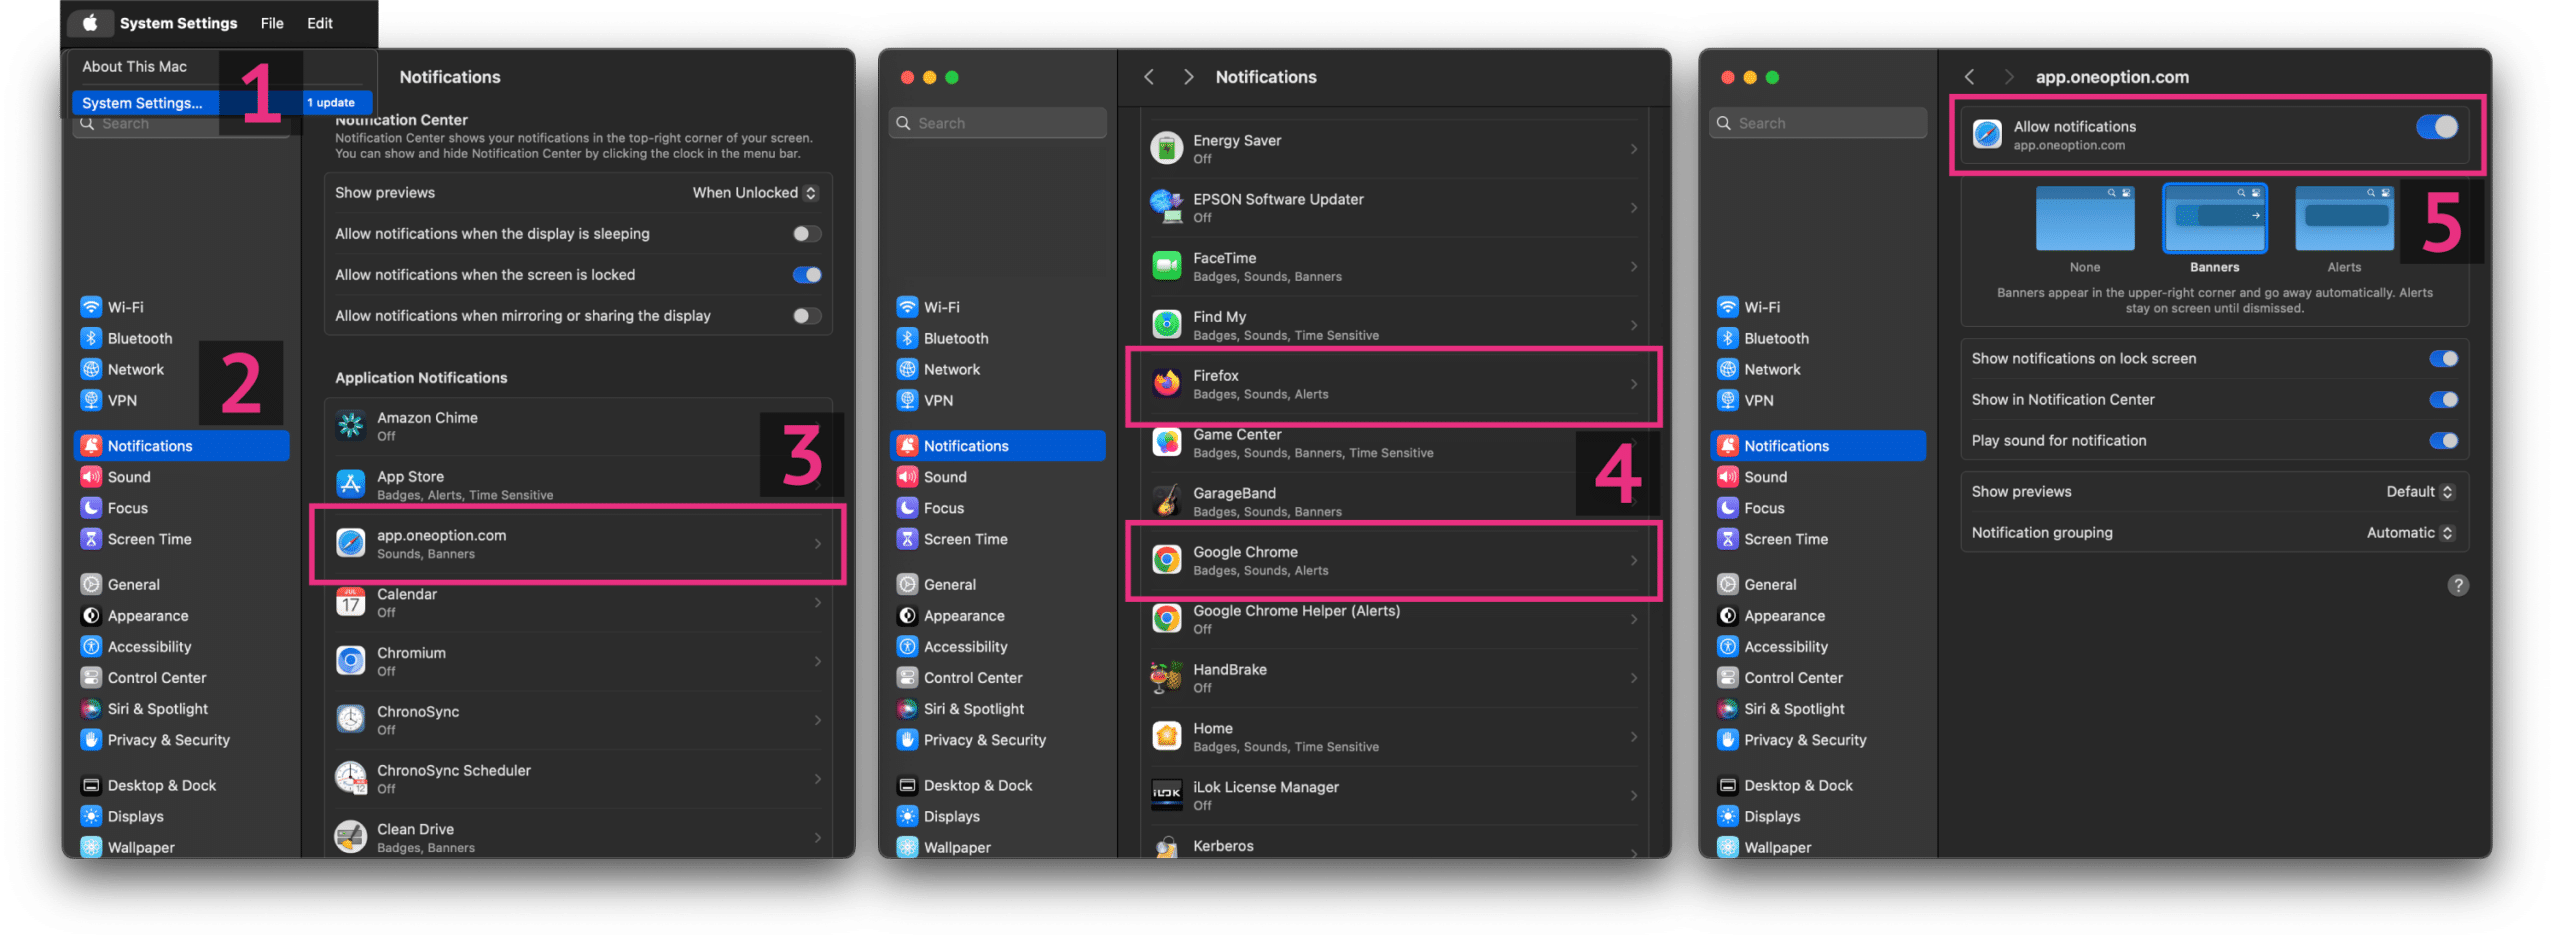
System Settings – Desktop Push Notifications – macOS/Apple
If after performing the above steps the Click To Test button does not cause show test notifications to show, additional configurations may be needed for them to work properly. In this case, follow the below instructions:
System Settings – Desktop Push Notifications – Windows
If after performing the above steps the Click To Test button does not cause show test notifications to show, additional configurations may be needed for them to work properly. In this case, follow the below instructions:

Safari Settings – Desktop Push Notifications

Chrome Settings – Desktop Push Notifications

Custom Alerts
Custom Alerts is our legacy alert tool for designing complex alerts using variables from Custom Search. With it, OSP can provide alerts when any number of stocks satisfy one or more conditions. This can be useful to traders in many situations: You may have a long list of stocks that meet nearly all of your criteria and want to be alerted to when they are fully satisfied. Or, you may have a list of stocks that fulfill your initial conditions, but want to be alerted when smaller-time-frame variables are met to help you pinpoint excellent entries. In these cases and others, Custom Alerts can serve you trading opportunities.
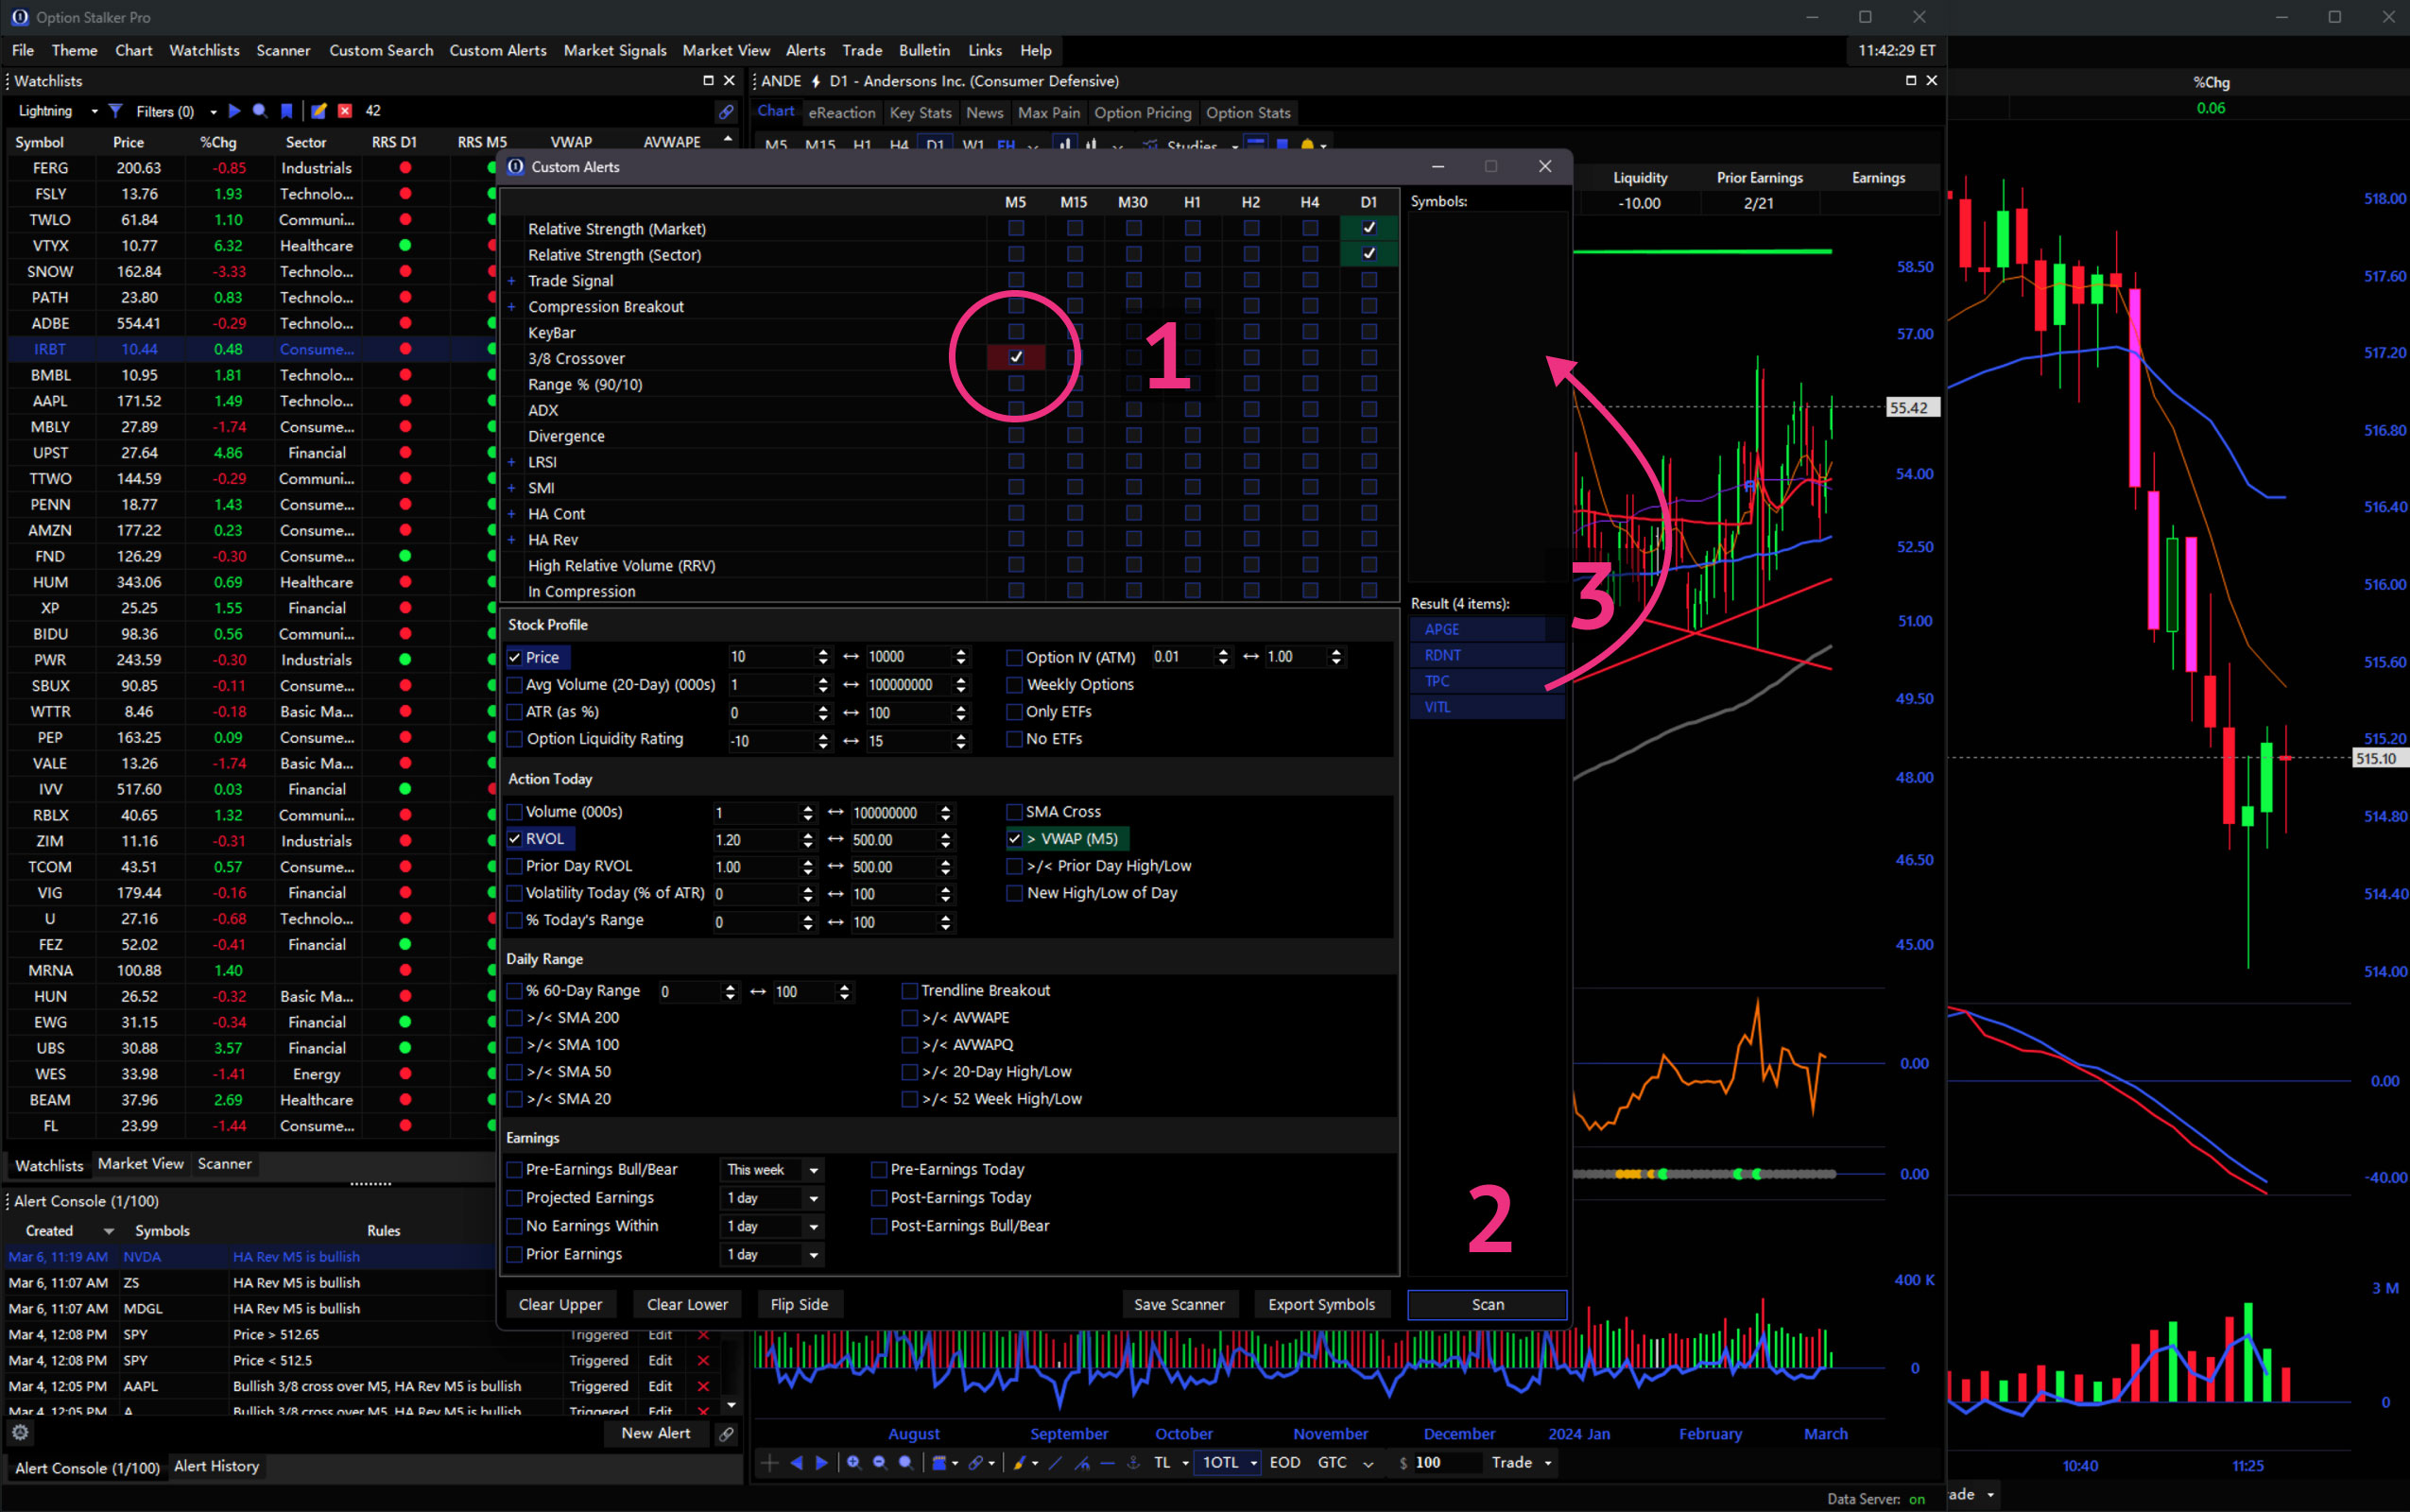
How To Use Custom Alerts
- Open the Custom Alerts window from the Main Menu.
1 - Enter the symbols on which you want to apply the Custom Alert. Type or copy/paste into the field in the upper-right.
2 - Configure the Custom Alerts variables to specify which high probability patterns to trigger an alert.
3 - Save the Custom Alert with the button in the lower-left. This will open the New Custom Alert save window where you can name and describe your alert.
4 - The Alert will appear in the Scanners panel under Alerts and stocks on the list that satisfy the criteria will be listed here.
5 - At anytime, you can click the Edit button in the Scanner Toolbar to view the Custom Alert variables. You can change them or update the symbols and Save again.
- When the parameters are met, an alert will pop up with the symbol(s).
Advanced Custom Alert Example
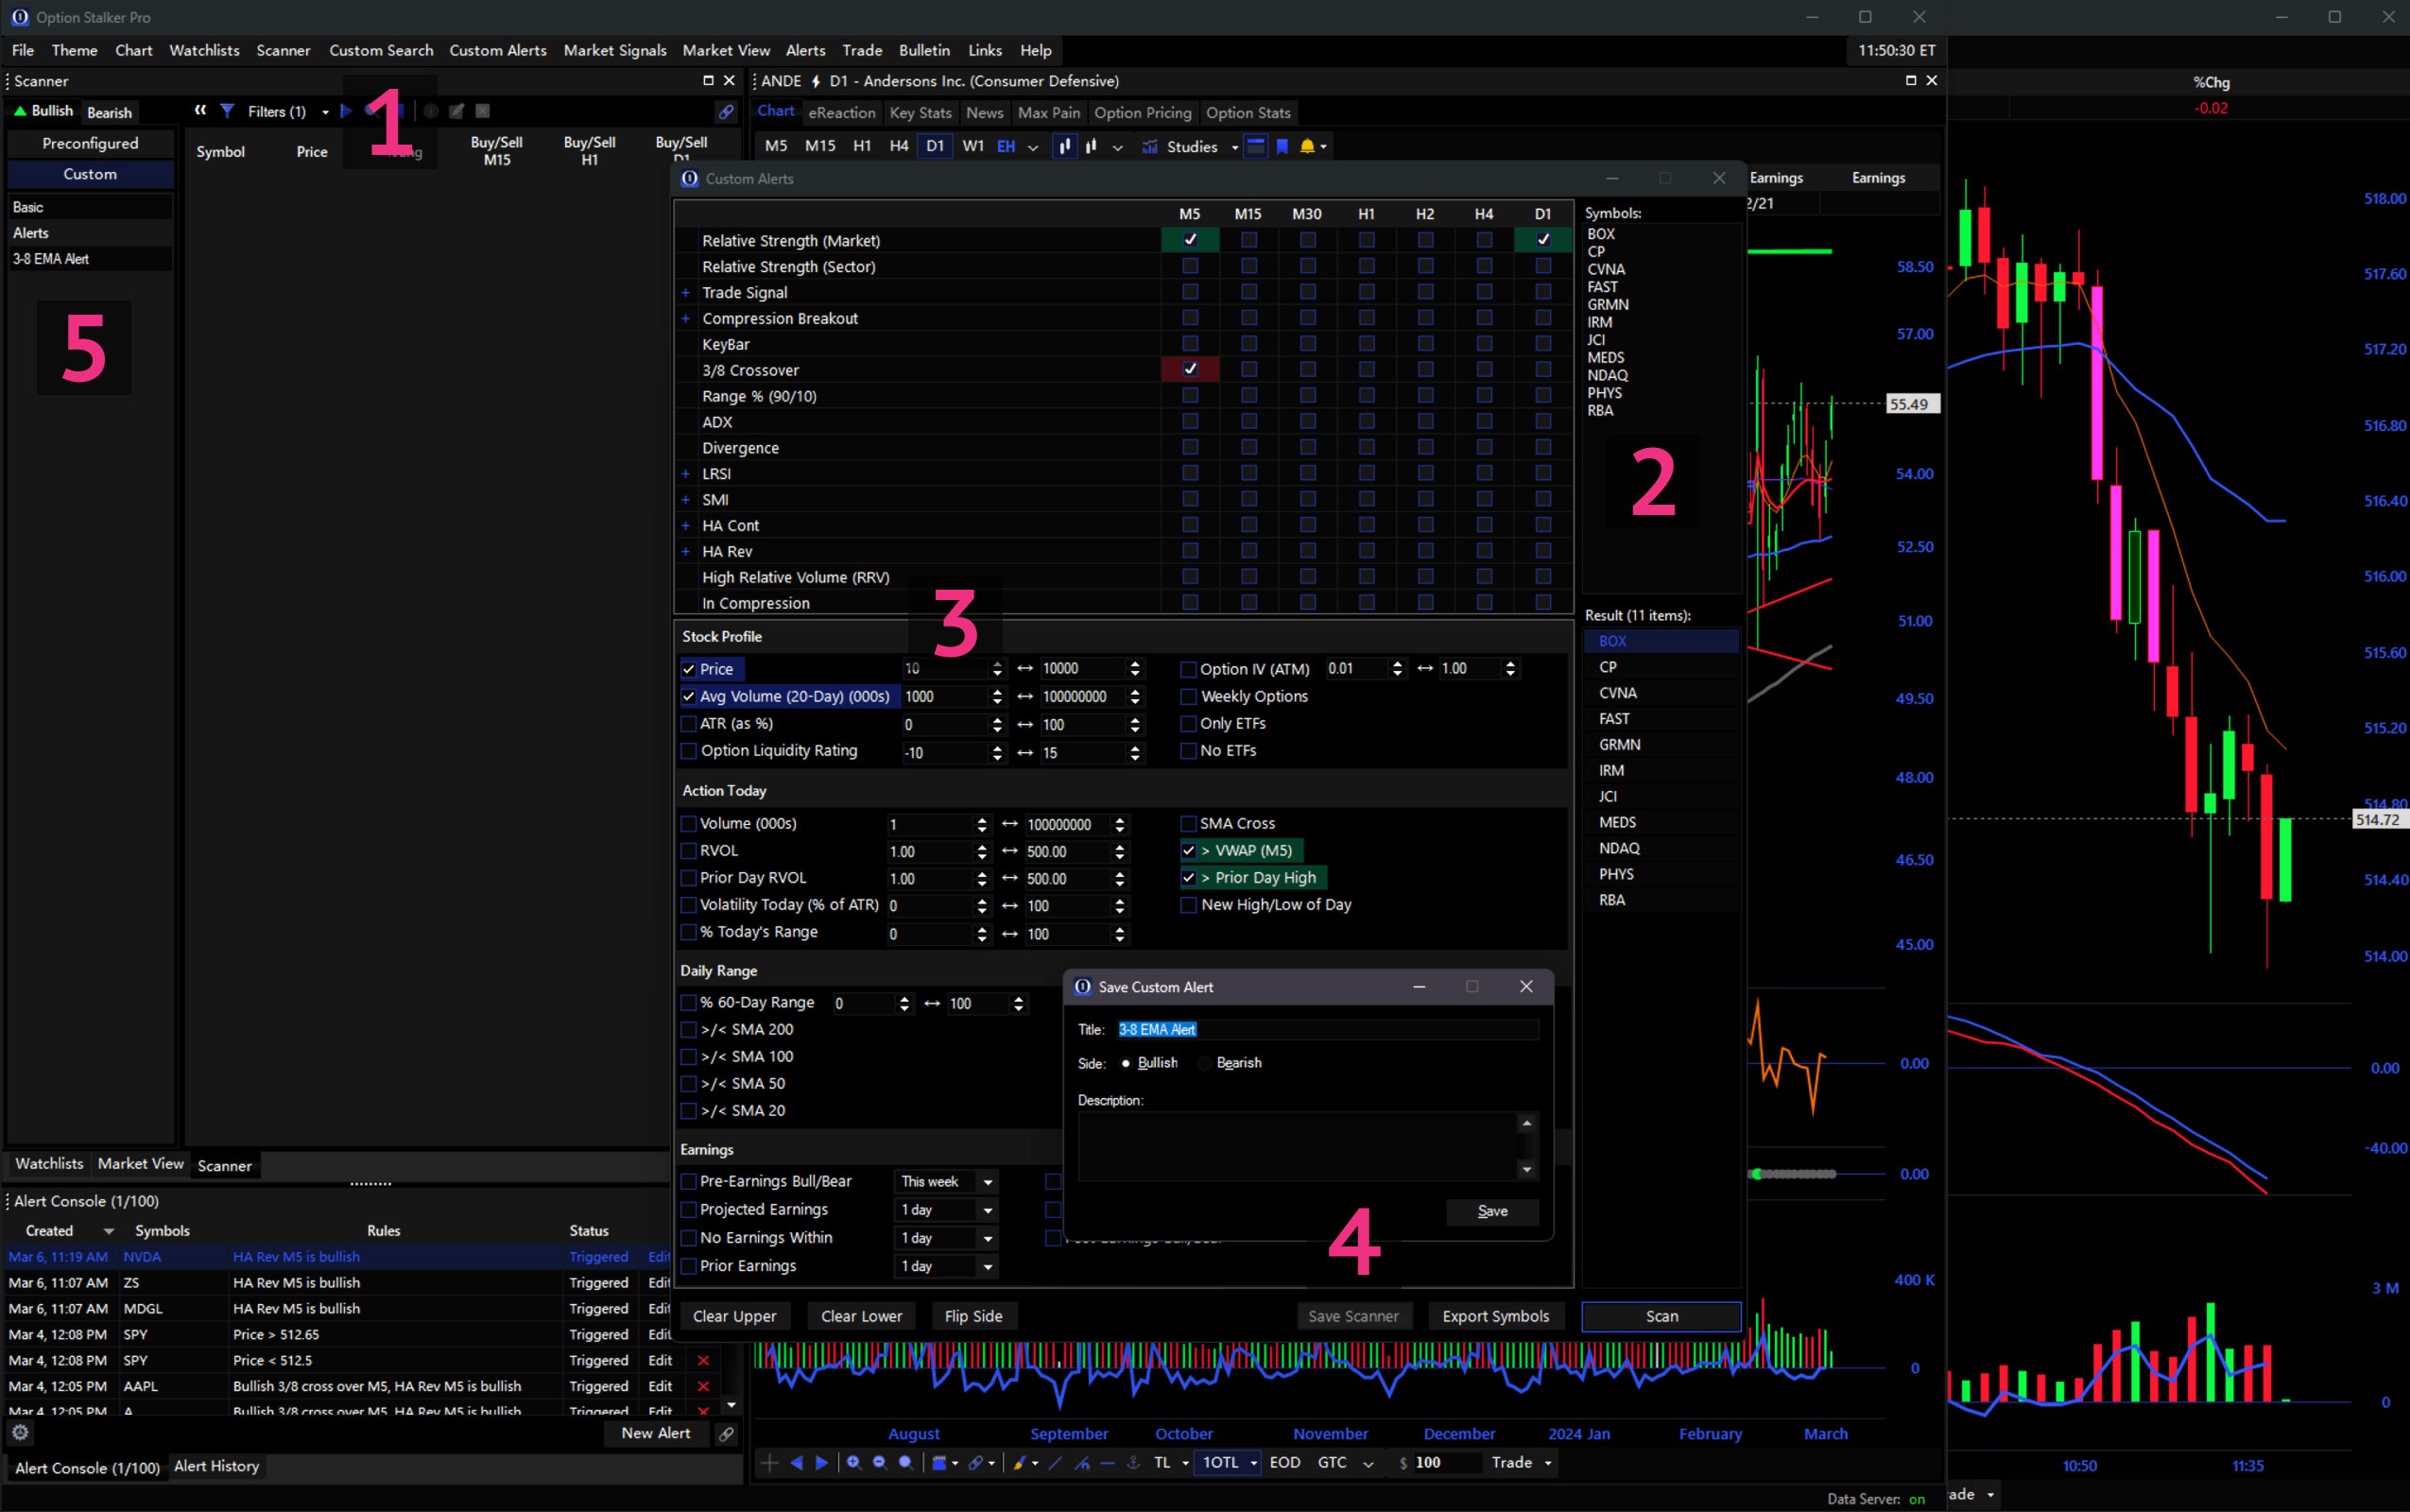
The following will describe how to both Scan for stocks using the Custom Alerts window, and then build an Alert within the same window.
- As shown in the first image, we first open Custom Alerts and define variables for weak stocks to day trade. In this example we have selected strong parameters on the daily timeframe, and one weak parameter on the 5 minute basis. This is our key variable. We are looking for stocks that are strong long-term, but are not yet showing short-term strength. This 5 minute key variable will be adjusted in our Custom Alert in the following steps.
1 - After setting the variables in step 1, we click Scan in the lower-right. This produces a list of stocks in the Results pane that match the specified criteria.
2 - We can now drag to select the list of stocks in Results, and paste them in the Symbols pane. We are preparing to apply a new Custom Alert on this list of stocks.
3
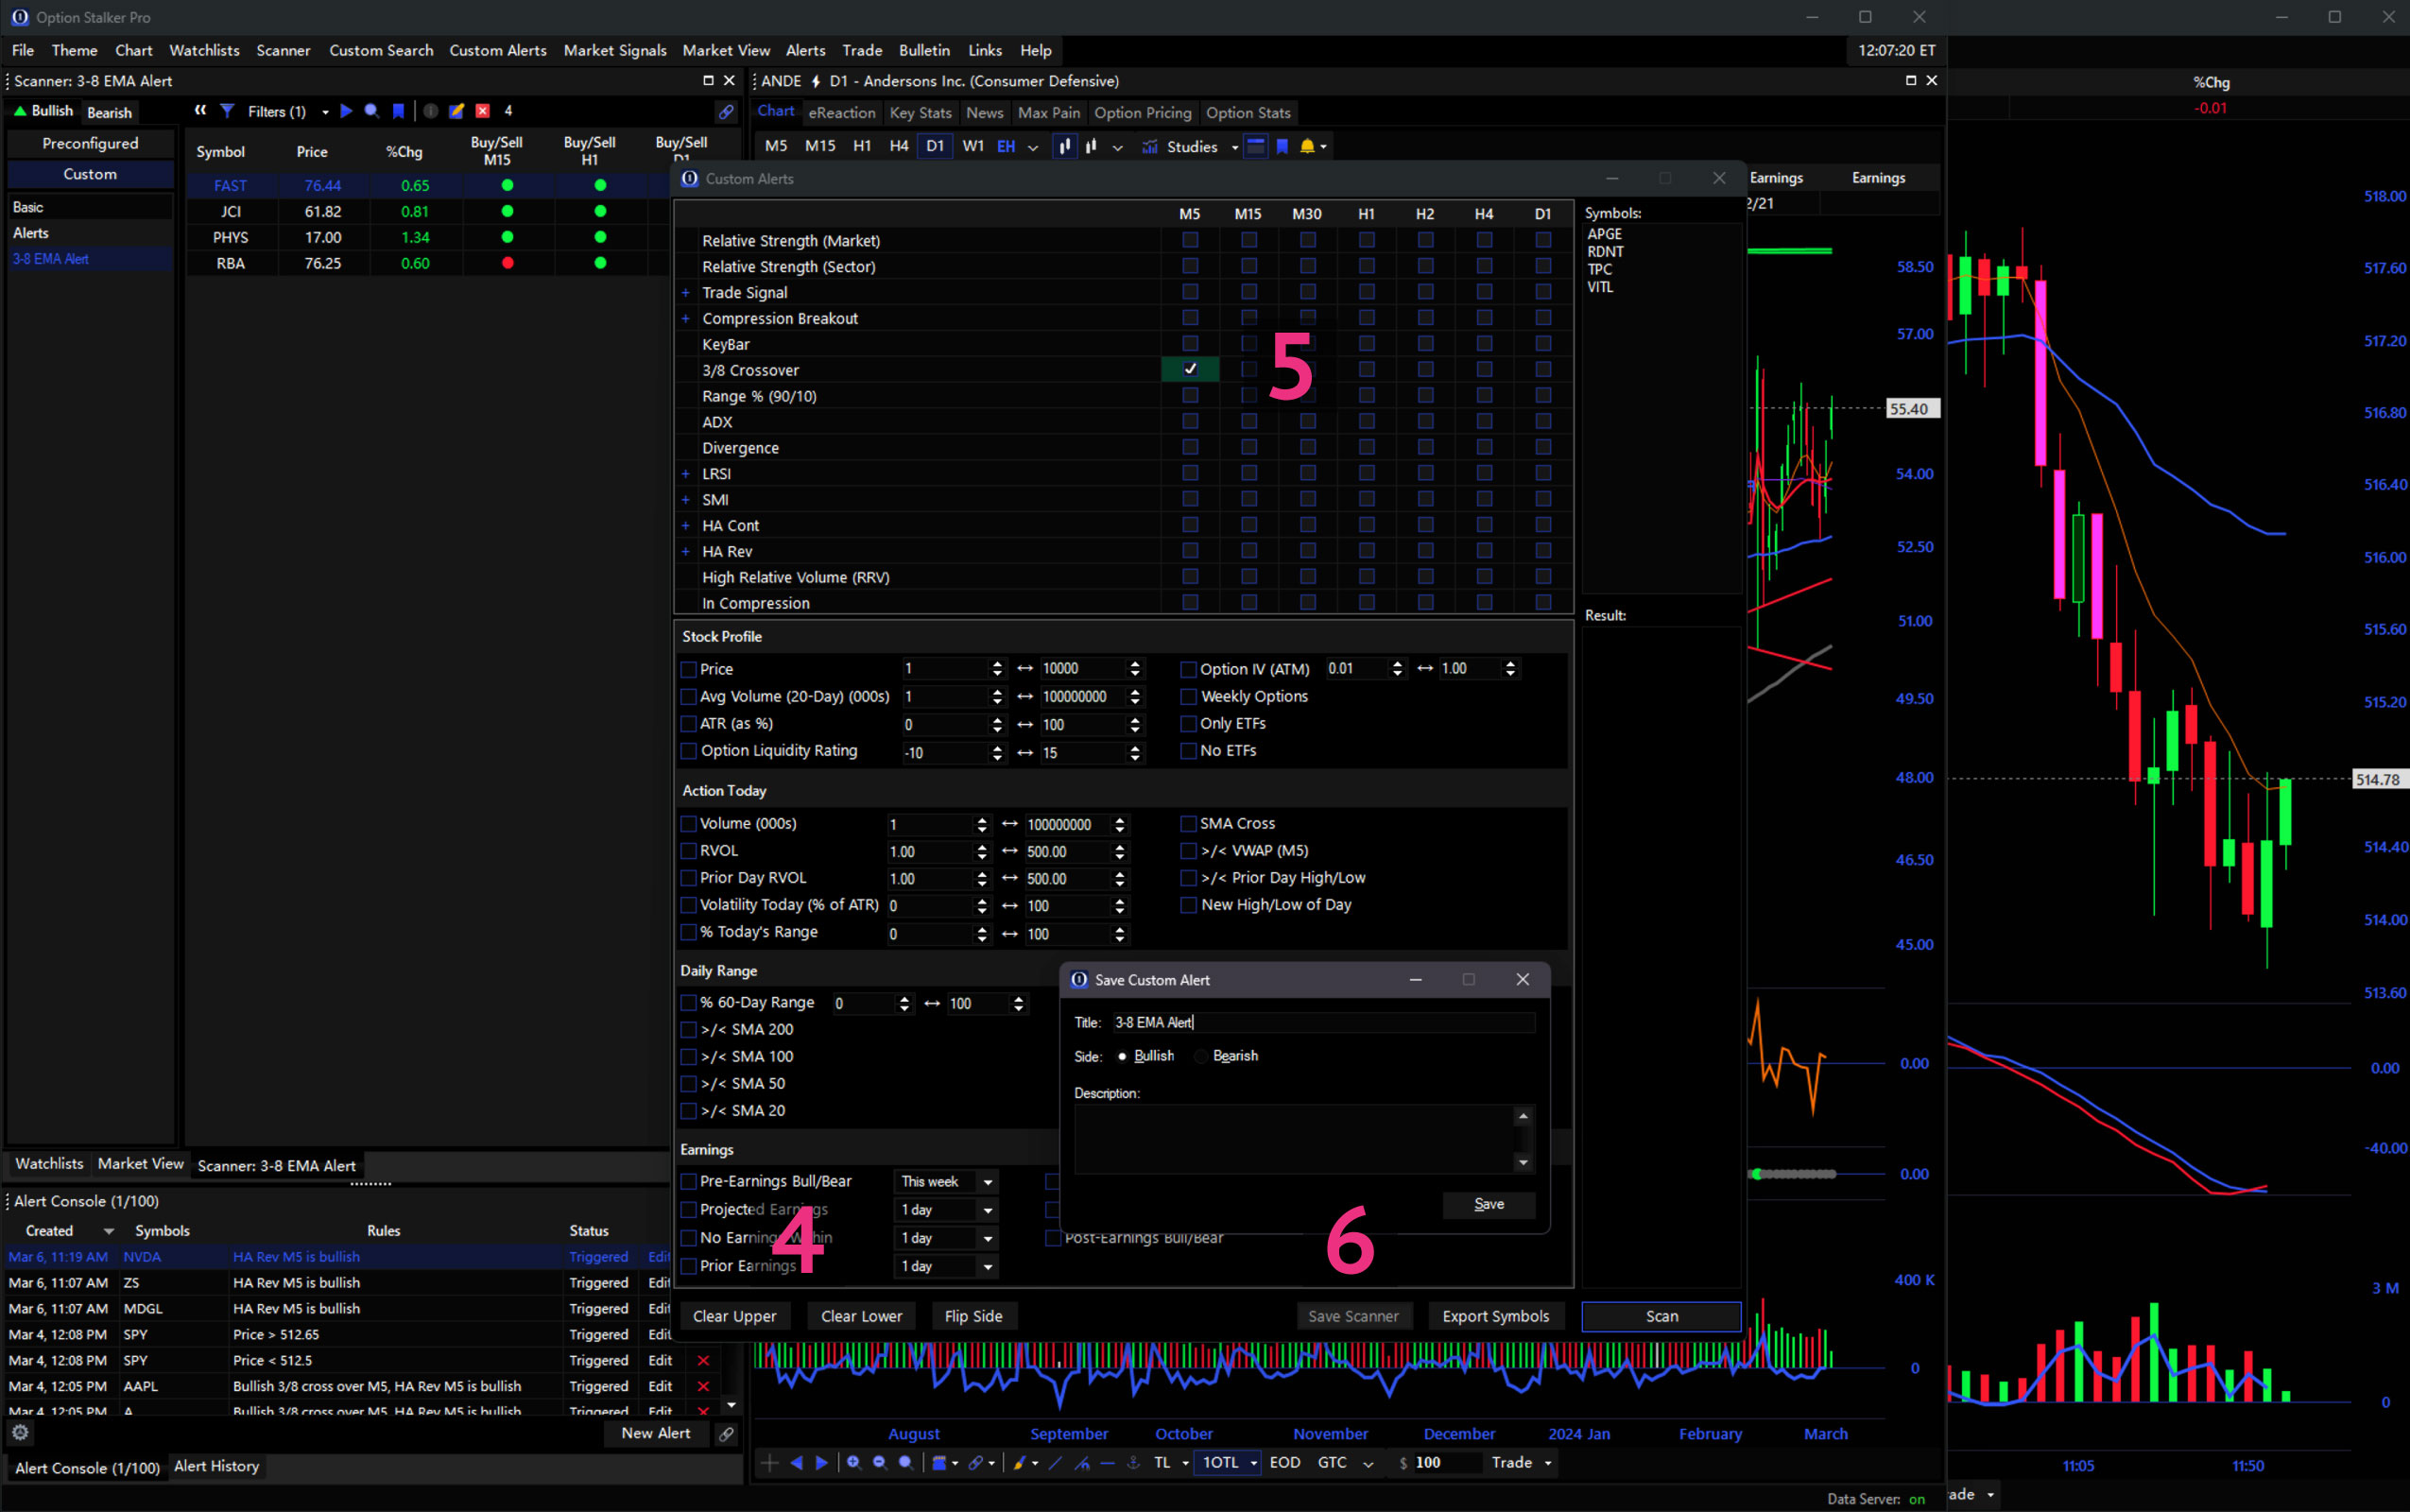
- In the next image, we click Clear Upper and Clear Lower to clear all the selected variables.
4 - Next, we check bullish (in green) parameter in the 5 minute timeframe where we selected bearish (in red) earlier.
5 - Finally, we press Save to save the Custom Alert. With the list of stocks in Symbols and the correct variable selected, OSP will now notify when any of these stocks flip from weak momentum on a 5 minute basis to strong momentum on a 5 minute basis.
6
From this example, we can see how Custom Alerts allow us to expand our search beyond what is possible with Custom Search and Preconfigured Scanners. With Custom Alerts, we also can find stocks before they fully fit our criteria and be alerted immediately when they do.
Inside Tip: Good key variables include the bullish and bearish counterparts for: Trade Signal, Strength vs SPY, Compression (In/Out), HA II, and Stochastics.
Trade Entry
The Trade panel is where you place trades, view orders, stage orders, and monitor your portfolio. It can be accessed by the Trade button in the Main Menu1, at the bottom of a chart2, or via Right-Click anywhere in the chart area.3 The Trade window contains four tabs and defaults to the most sensitive function, Order Entry.4
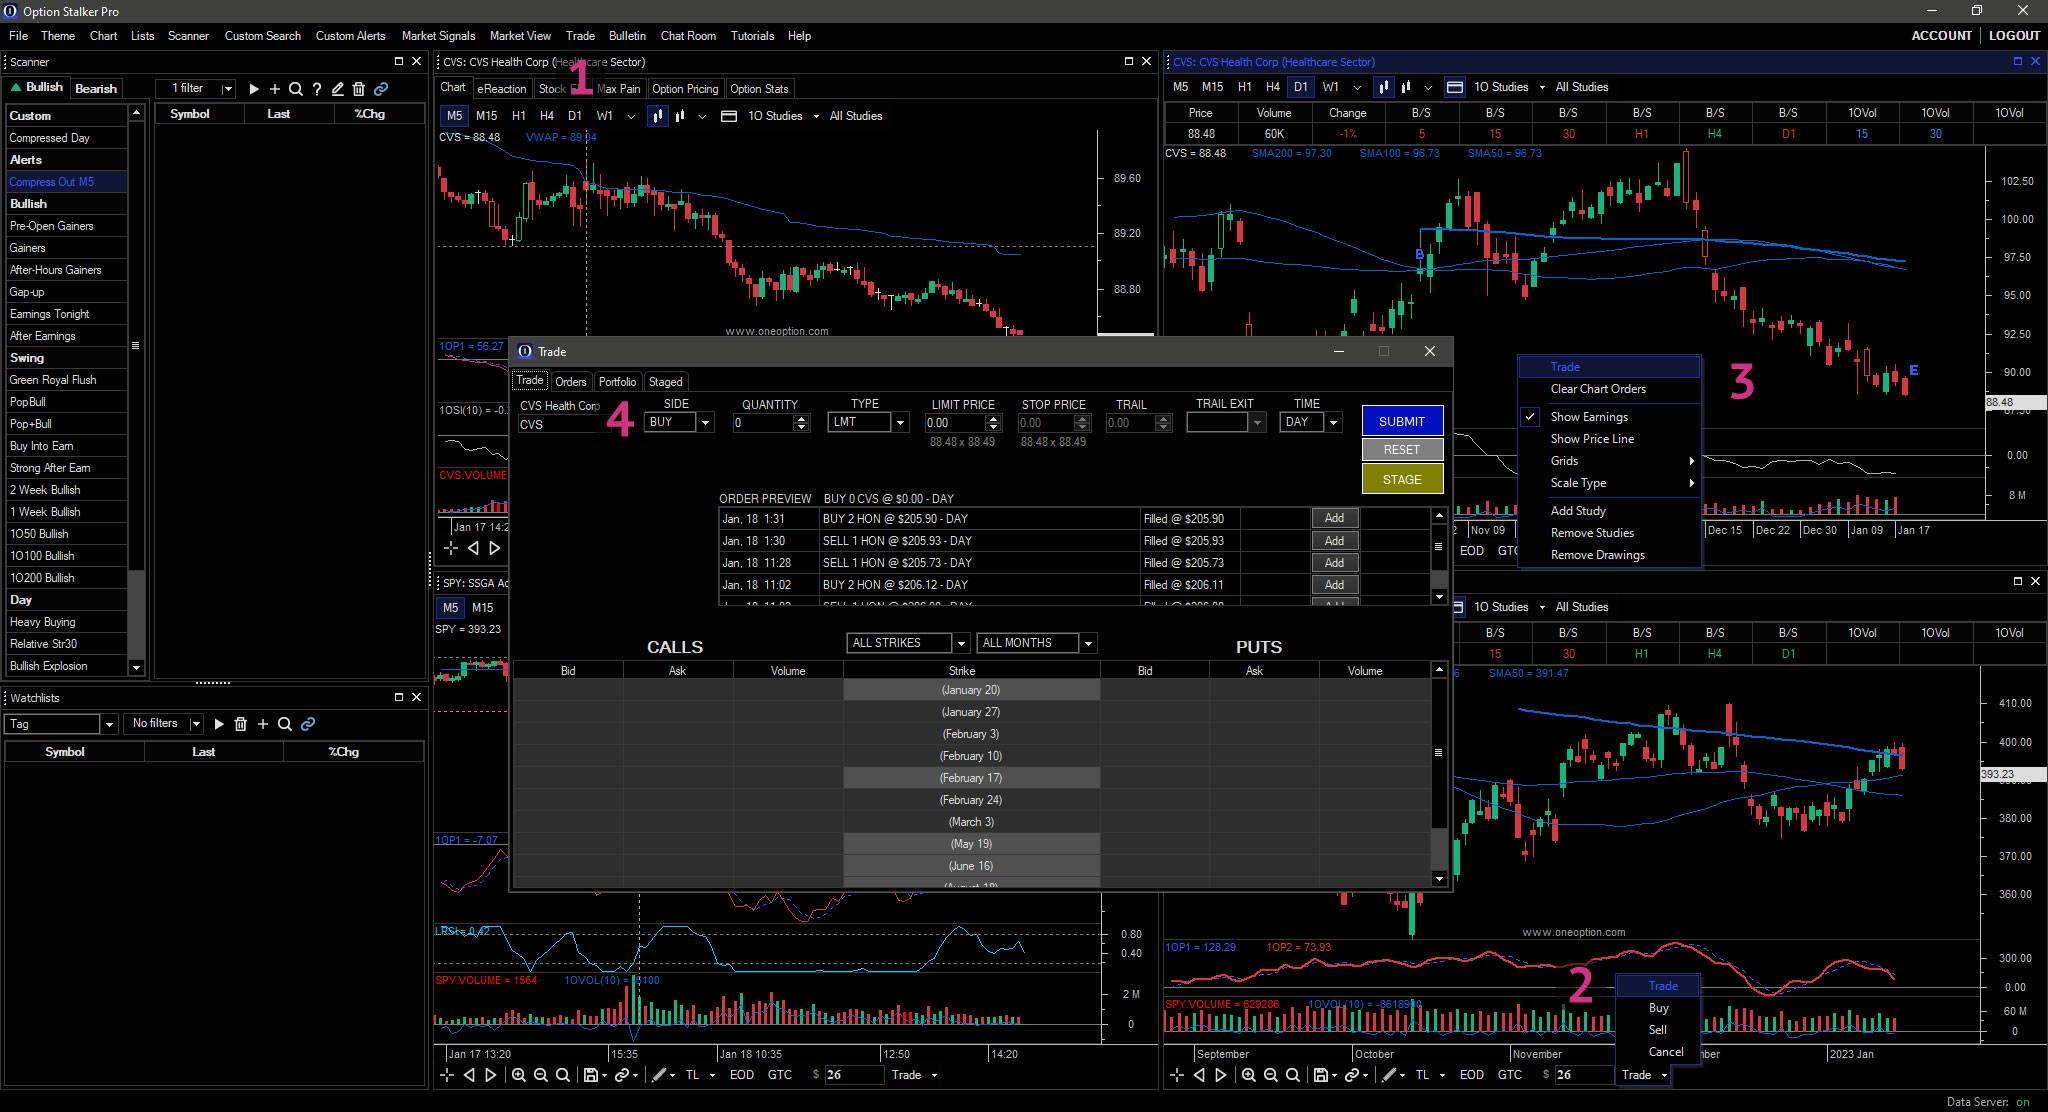
The Trade feature is only available if a brokerage connection is set up as explained at the top of this manual.
Order Entry: Stock Shares
By default, the top of Order Entry is used to submit and stage orders for shares when no options are selected at the bottom of the Trade tab. To use it, specify the symbol1, side2, quantity3, order type4, limit price5, stop price6 (for stop and OCO orders), trail amount7, exit type8, duration9 and then click Submit10 to place the order. Use the Reset11 button to clear all the order entry fields. The Stage button can be used to track the stock or options in the Staged tab.12 Review your order before submitting using the Preview line.13 Below it is the Order History area, where previous and current orders are listed.14 To quickly set price, click either the Bid (left) or Ask (right) beneath the Limit Price or Stop Price fields.15
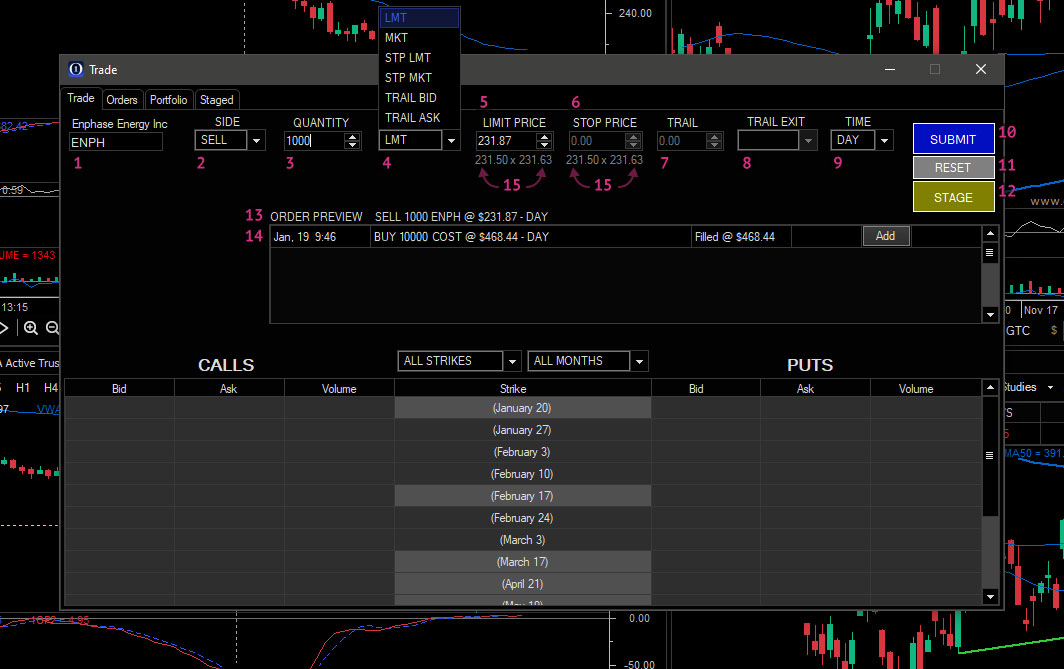
Please Note: Trailing orders reside on your PC and will be lost if disconnected. OCO orders are available on Tradier only and require a limit price (target) and a stop price. The stop is a stop limit order.
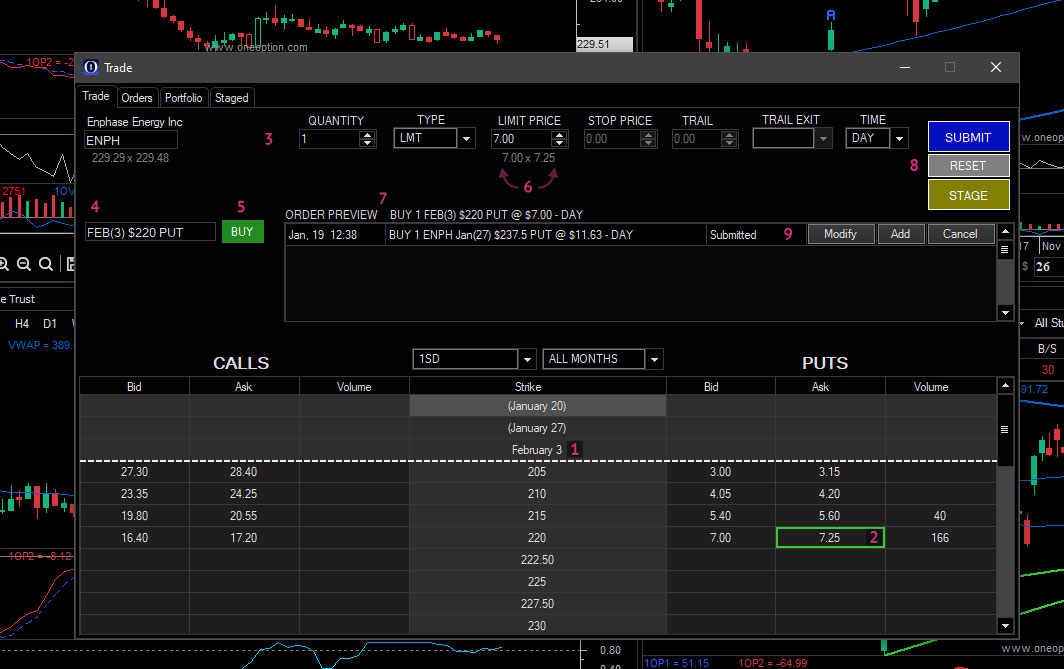
Order Entry: Options
To trade options, click on an Expiration Date1 to reveal the Options Chain. Then, click the Bid or Ask of the desired Strike Price to begin creating an options order.2 The specified option will load into the Order Entry above.3 Pending orders also appear on the left of the Orders pane4, and are indicated by a border in the Options Chain.2 You can quickly switch trade direction by clicking the Buy or Sell button in a pending order.5 Adjust the price by typing in the Limit Price input or by clicking the Bid or Ask below it.6 Just like when creating orders for shares, the Order Preview will display a short description of your order.7 Click Submit to submit the trade, Reset to clear fields, or Stage to stage the order.8 Once submitted, Open orders will display in the Orders pane where they can be modified, or where you can add a similar order.9
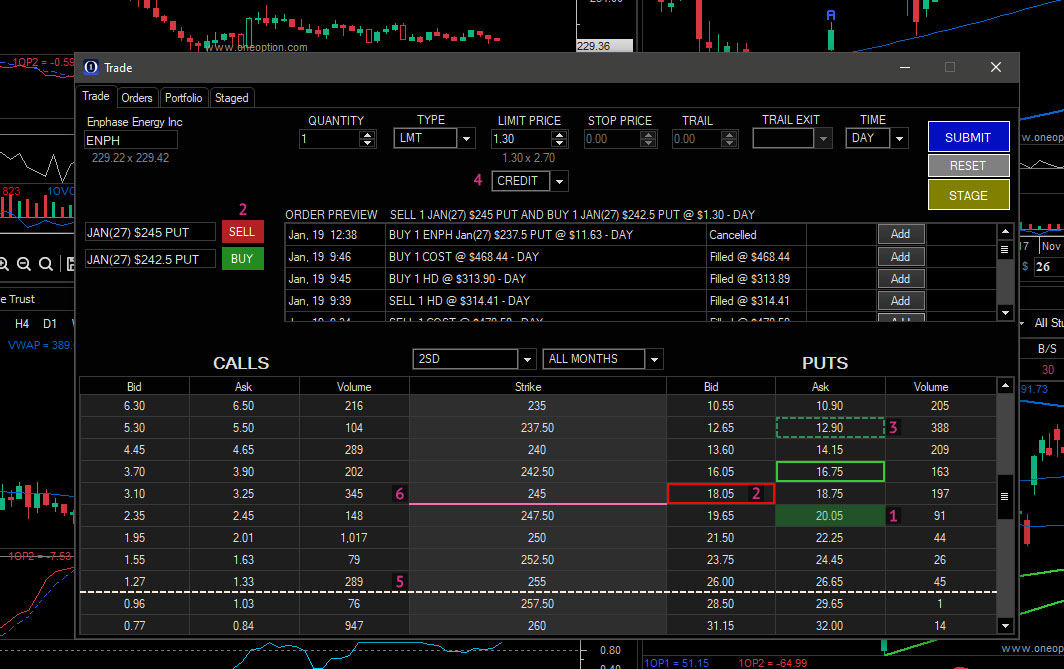
Advanced Options Features
Within the interface, OSP includes the following advanced options Order Entry features:
- Preexisting positions are indicated in the Options Chain with a color-shaded Bid or Ask box.
1 - By default, clicking Ask will load a Buy order and clicking a Bid will load a Sell order.
2 - You can drag the selected box of a pending order to change the strike price. The new price will be bordered with a dashed line.
3 - The system automatically calculates credit or debit.
4 - Months are initially compressed to reduce scrolling.
- Open positions are displayed initially to facilitate fast exits.
- Position quantities are auto-loaded.
- Standard deviations (1 & 2) are delineated within the Options Chain by dotted lines for credit spreads.
5 - SMAs are delineated within the Options Chain by solid lines.
6 - Trailing stops are available for single leg option orders.
- Place OCO orders for single leg options orders (Traider only).
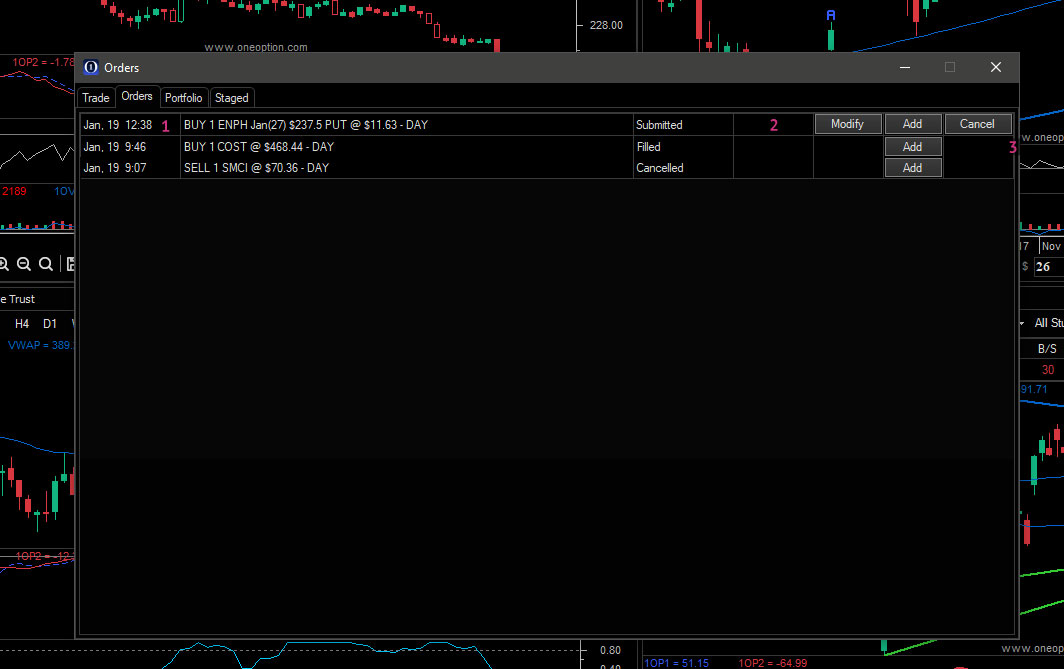
Orders
The Orders tab provides an expanded view of your order history. Orders are listed in reverse chronological order and described with an efficient shorthand.1 Live quotes are provided for open or pending orders.2 Use the buttons on the right of each order to Modify, Add or Cancel orders.3
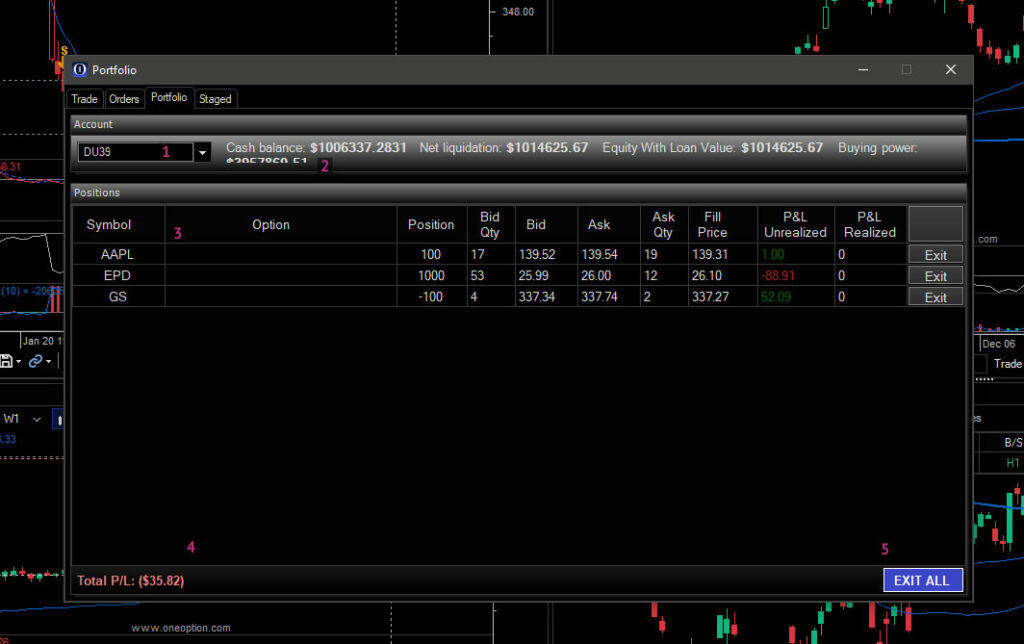
Portfolio
The Portfolio tab provides vital information about your account and positions. Select an account from the dropdown in the top.1 The total cash, equity and buying power (margin) will display to the right.2 Positions are listed in the table below, calculating P&L with real-time updates.3 Total P&L is listed at the bottom of the screen.4 For emergencies, the fail safe Exit All button will exit all positions at market price.5
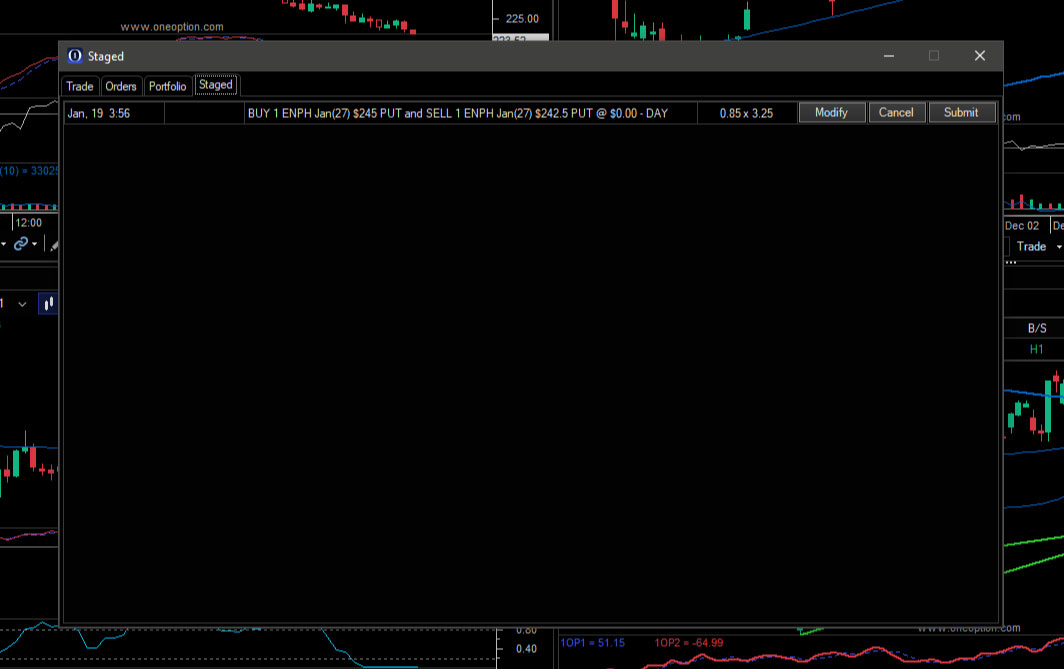
Staged Orders
The Staged feature was added to make it easy to trade single and multi-legged spreads. Using the options chains in Order Entry takes time to configure and order, and this is difficult to do when the market is moving fast or you have multiple spreads you want to enter. Staged orders allow you to plan ahead by staging orders preemptively so and place them later with a single click.
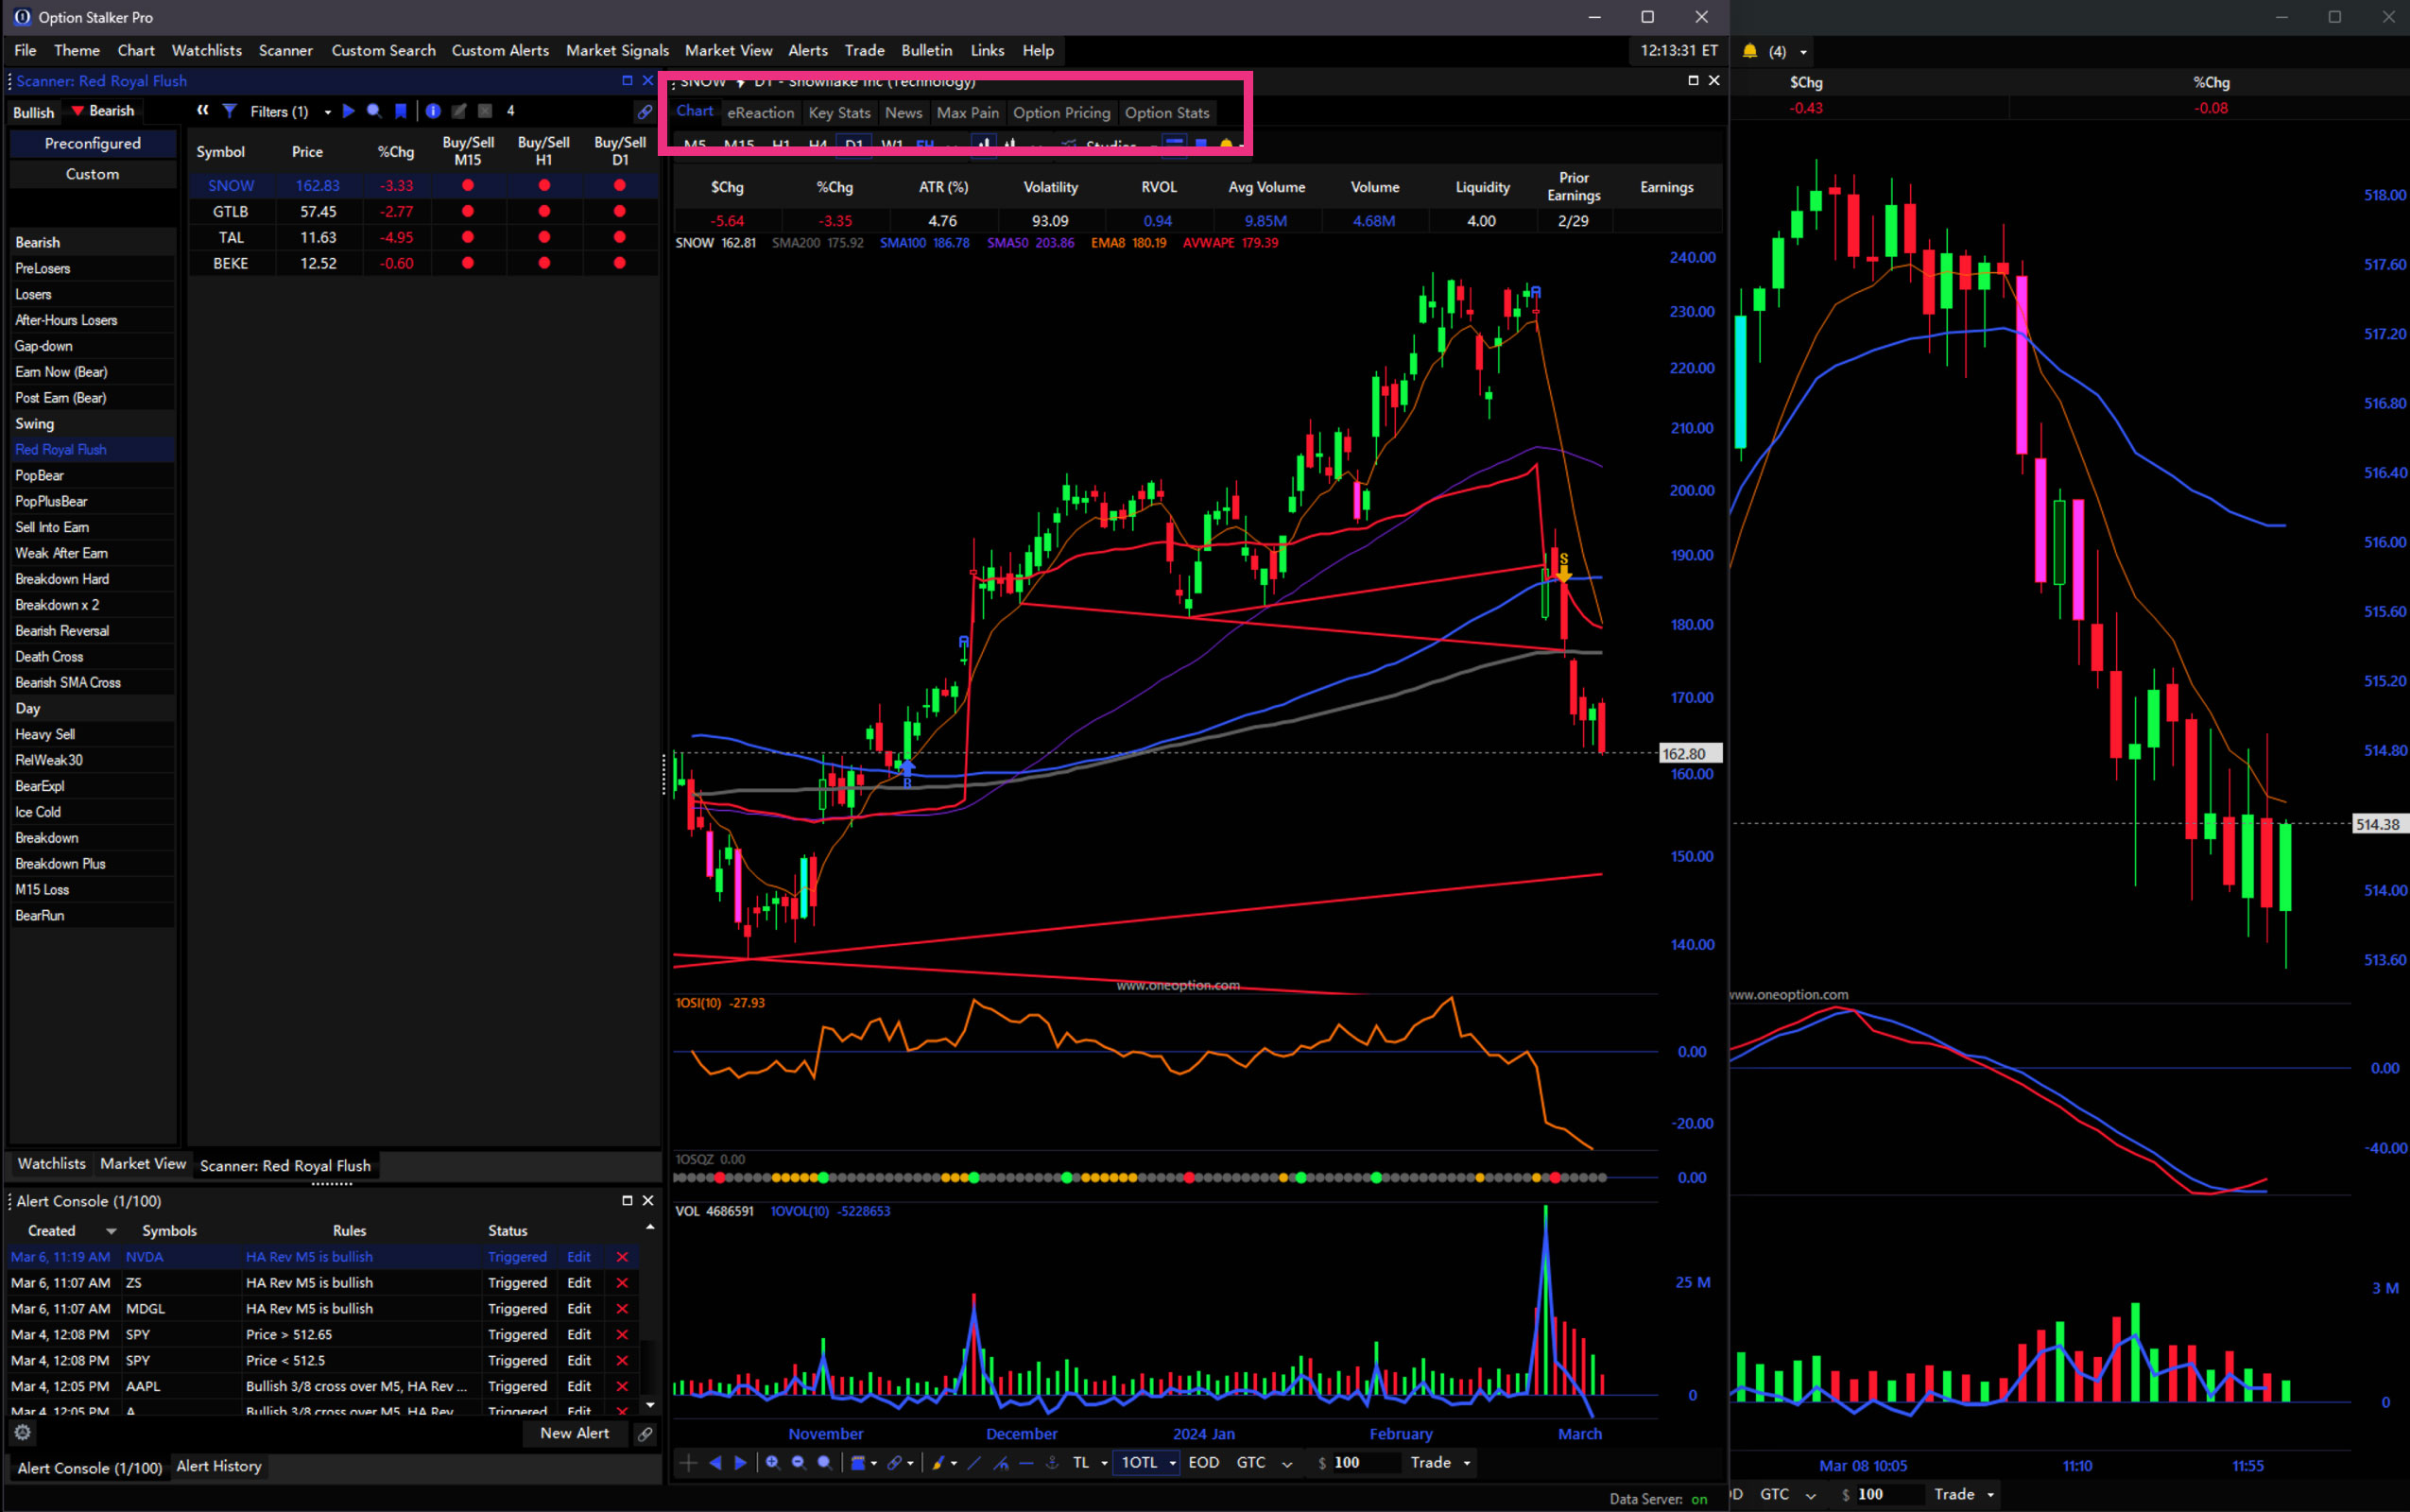
Main Chart Tabs
The tabs found in the Main Chart panel provide symbol-specific information where you can perform additional technical, fundament and option related research.
eReaction
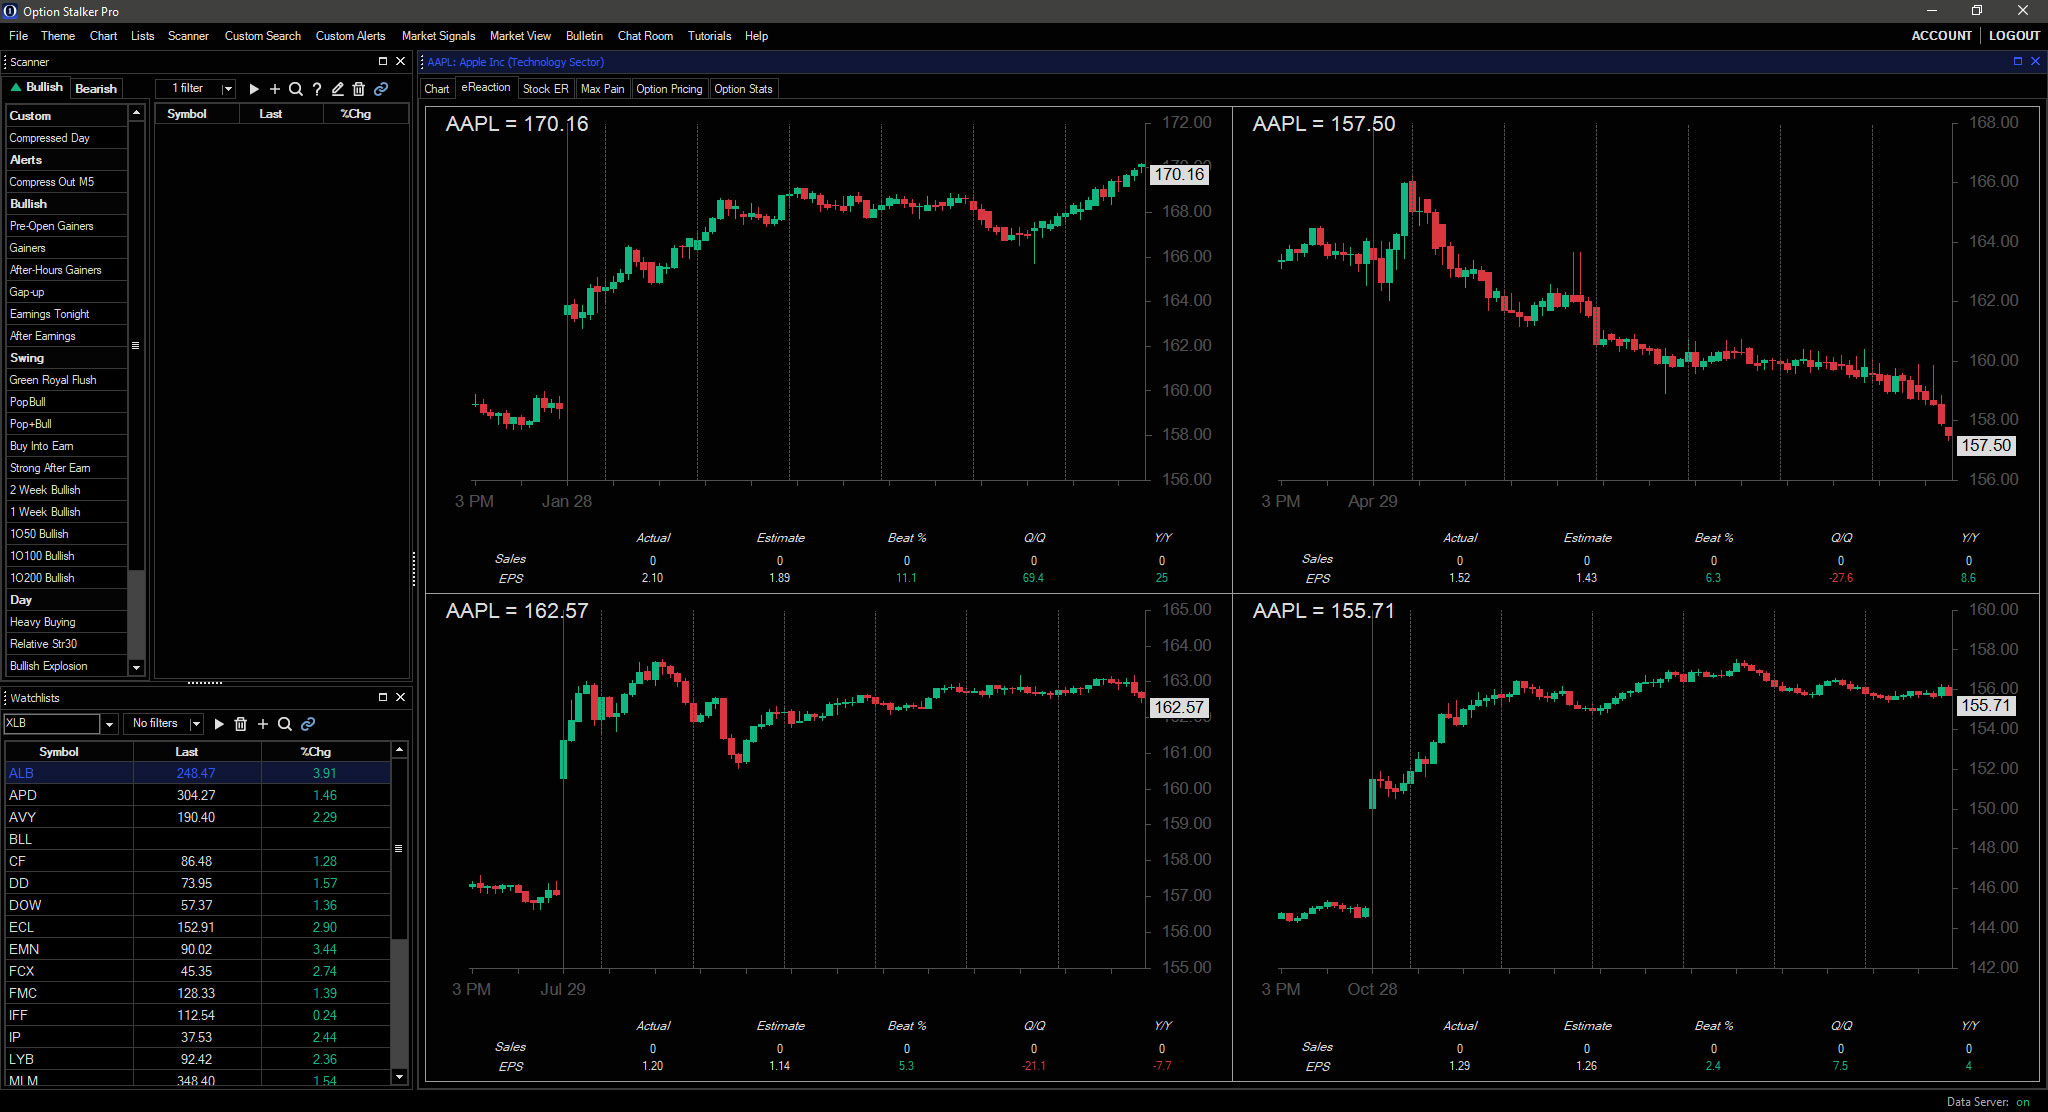
This study shows a 5-minute chart of the selected symbol immediately after posting earnings over the last 4 quarters. Post-earnings traders can look for patterns to inform their trading. In the following image, you can see that of the three earnings reports that resulted in gaps the following day, AAPL either maintained its price or continued in the direction of the gap.
Stock ER
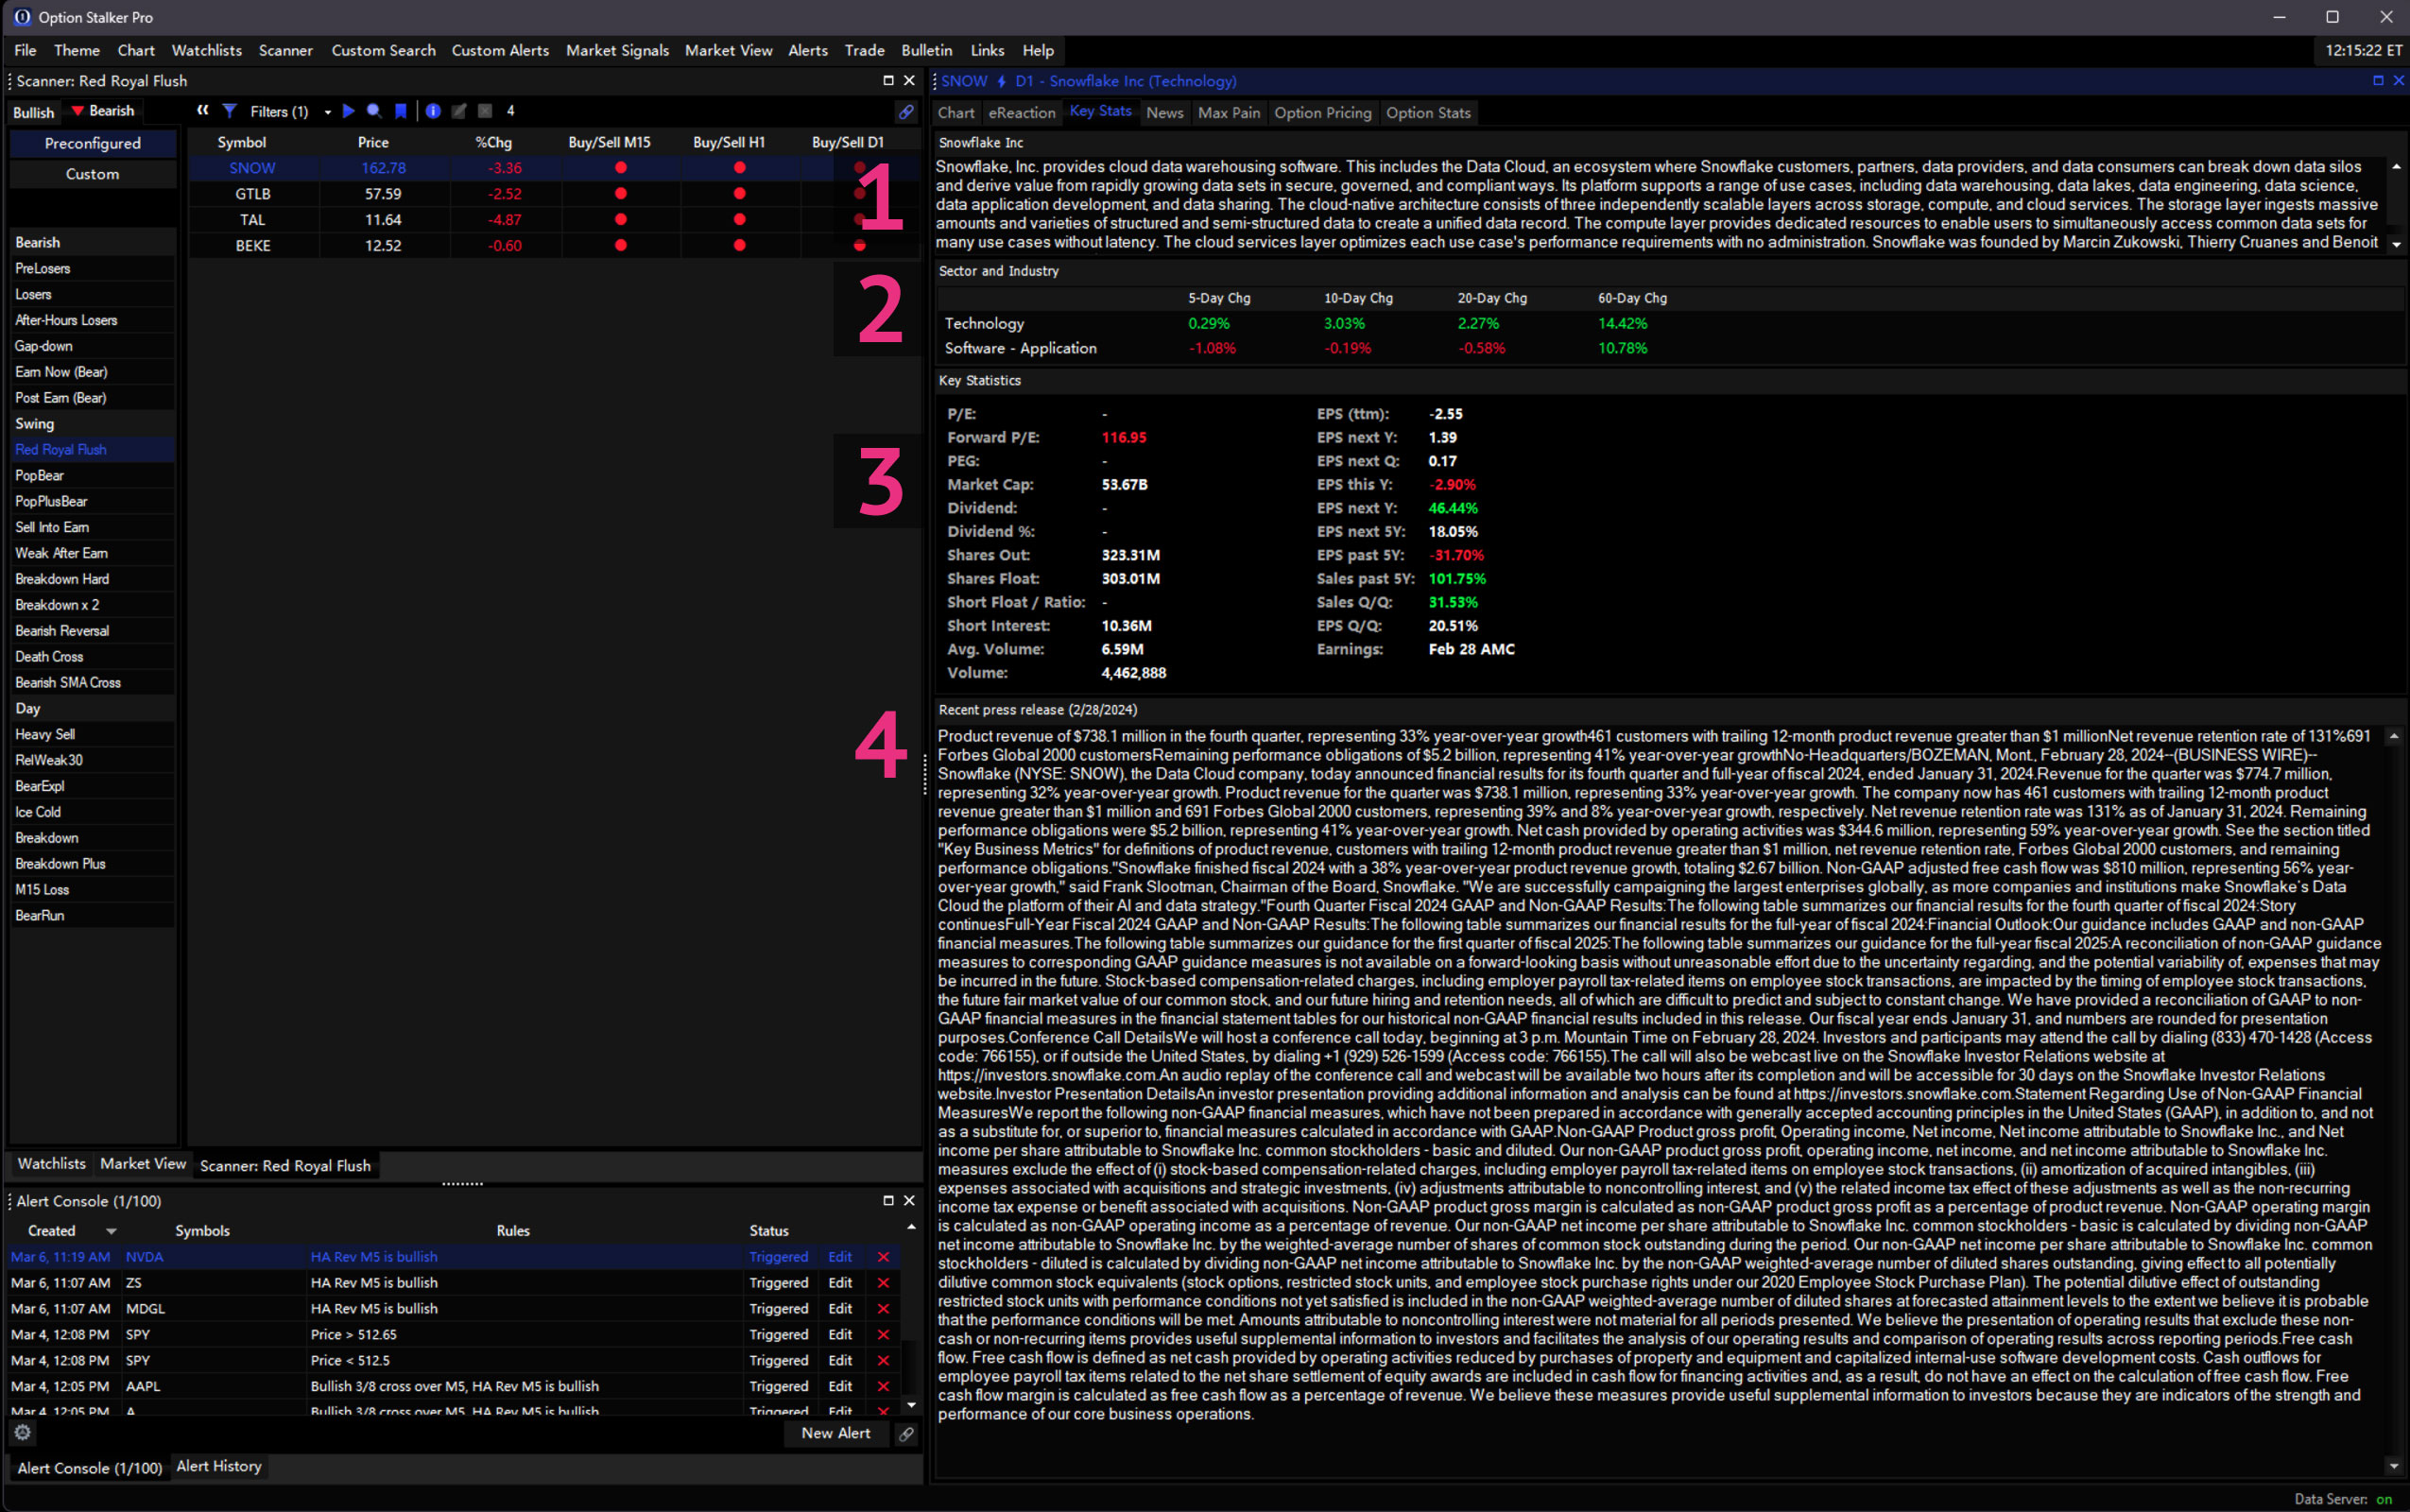
The Stock Expert Rating (ER) tab provides valuable technical and fundamental information about a stock. Here you can find the company description1, the stock group and sector with performance statistics2, key statistics and financial ratios3, and its most recent earnings report press release.4
Max Pain
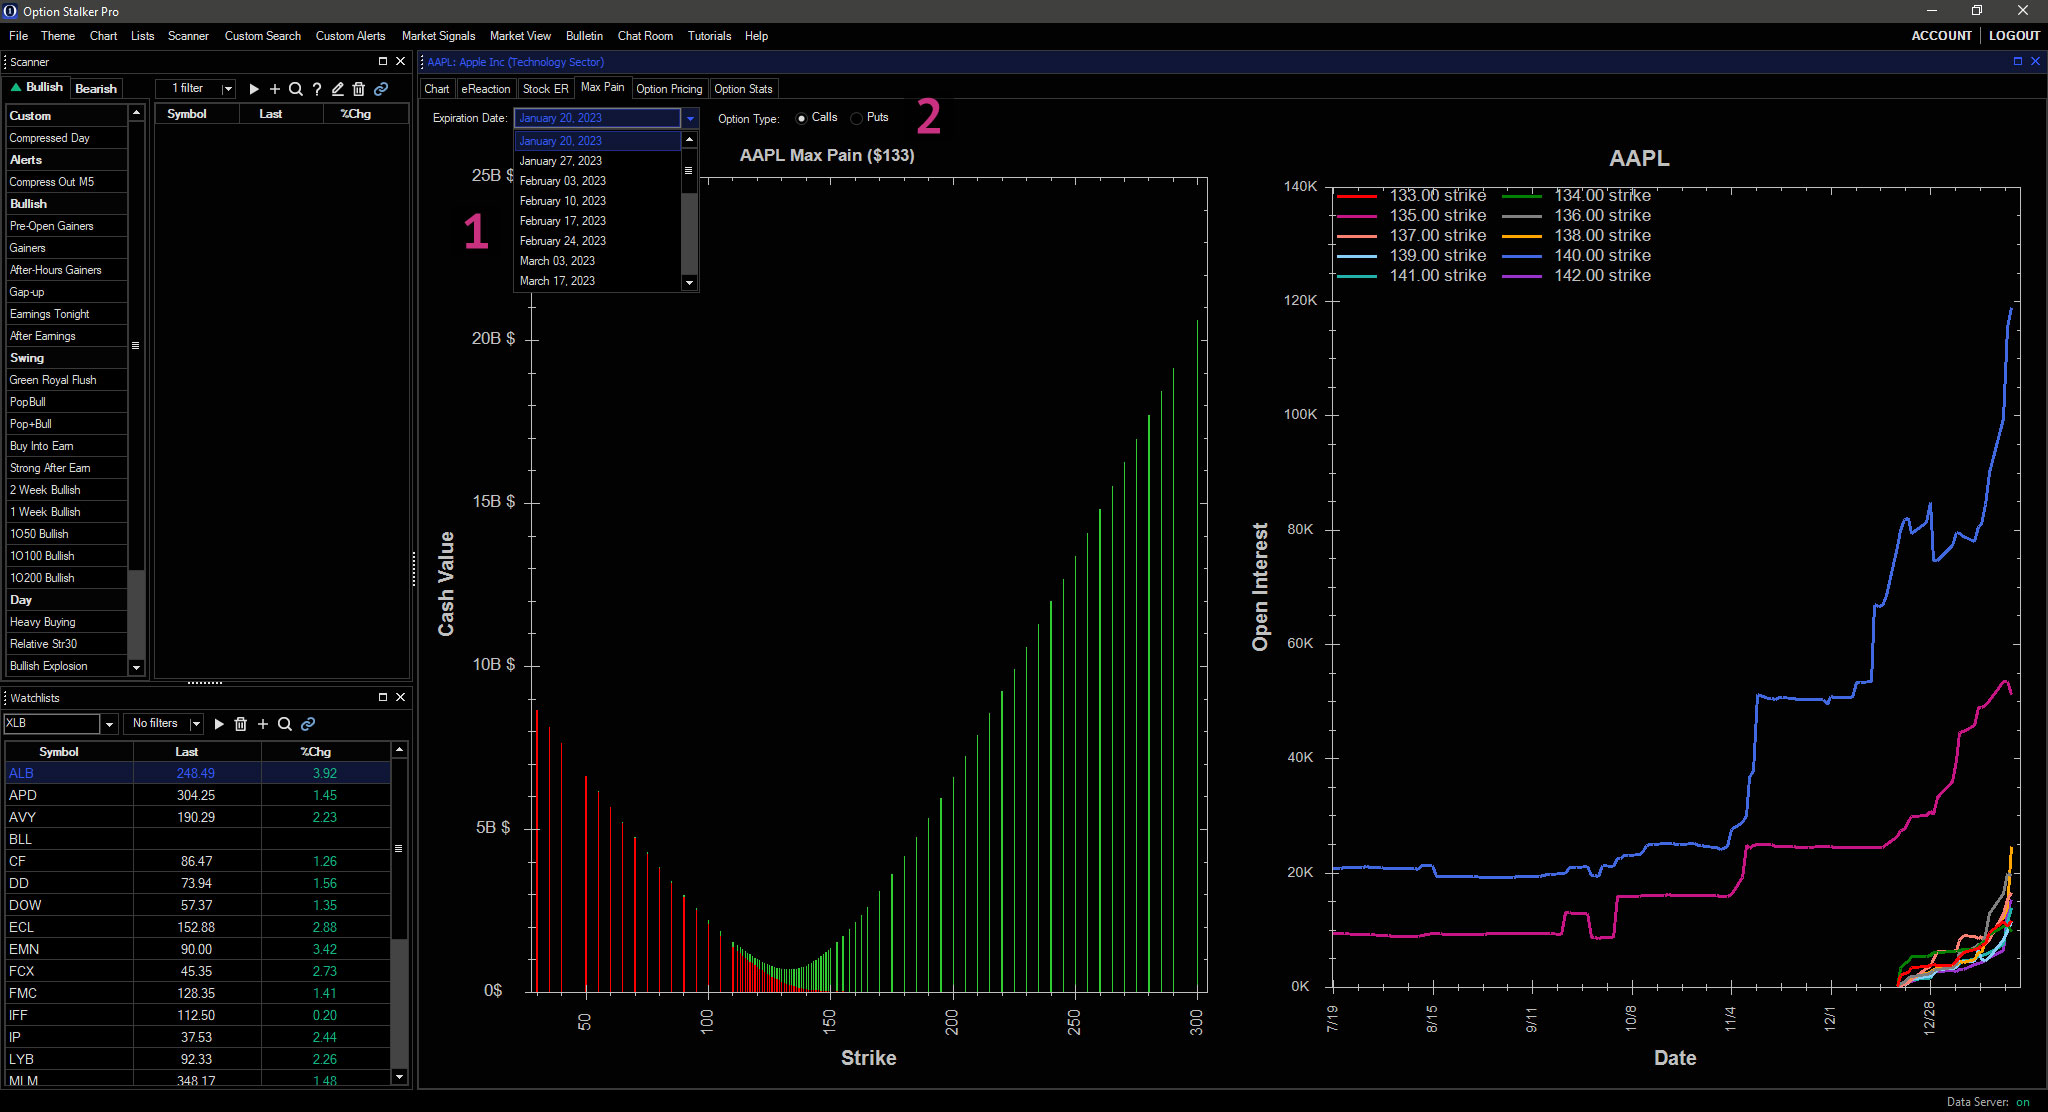
The theory behind Max Pain is that the stock will migrate to the strike price where the most options will expire. This data is useful when the stock is close to the max pain number and there are only a few days left before options expiration. It shows the bias for option open interest. To use Max Pain, select the expiration date1 and calls or puts2. Then monitor changes in open interest for various strike prices.
Option Pricing
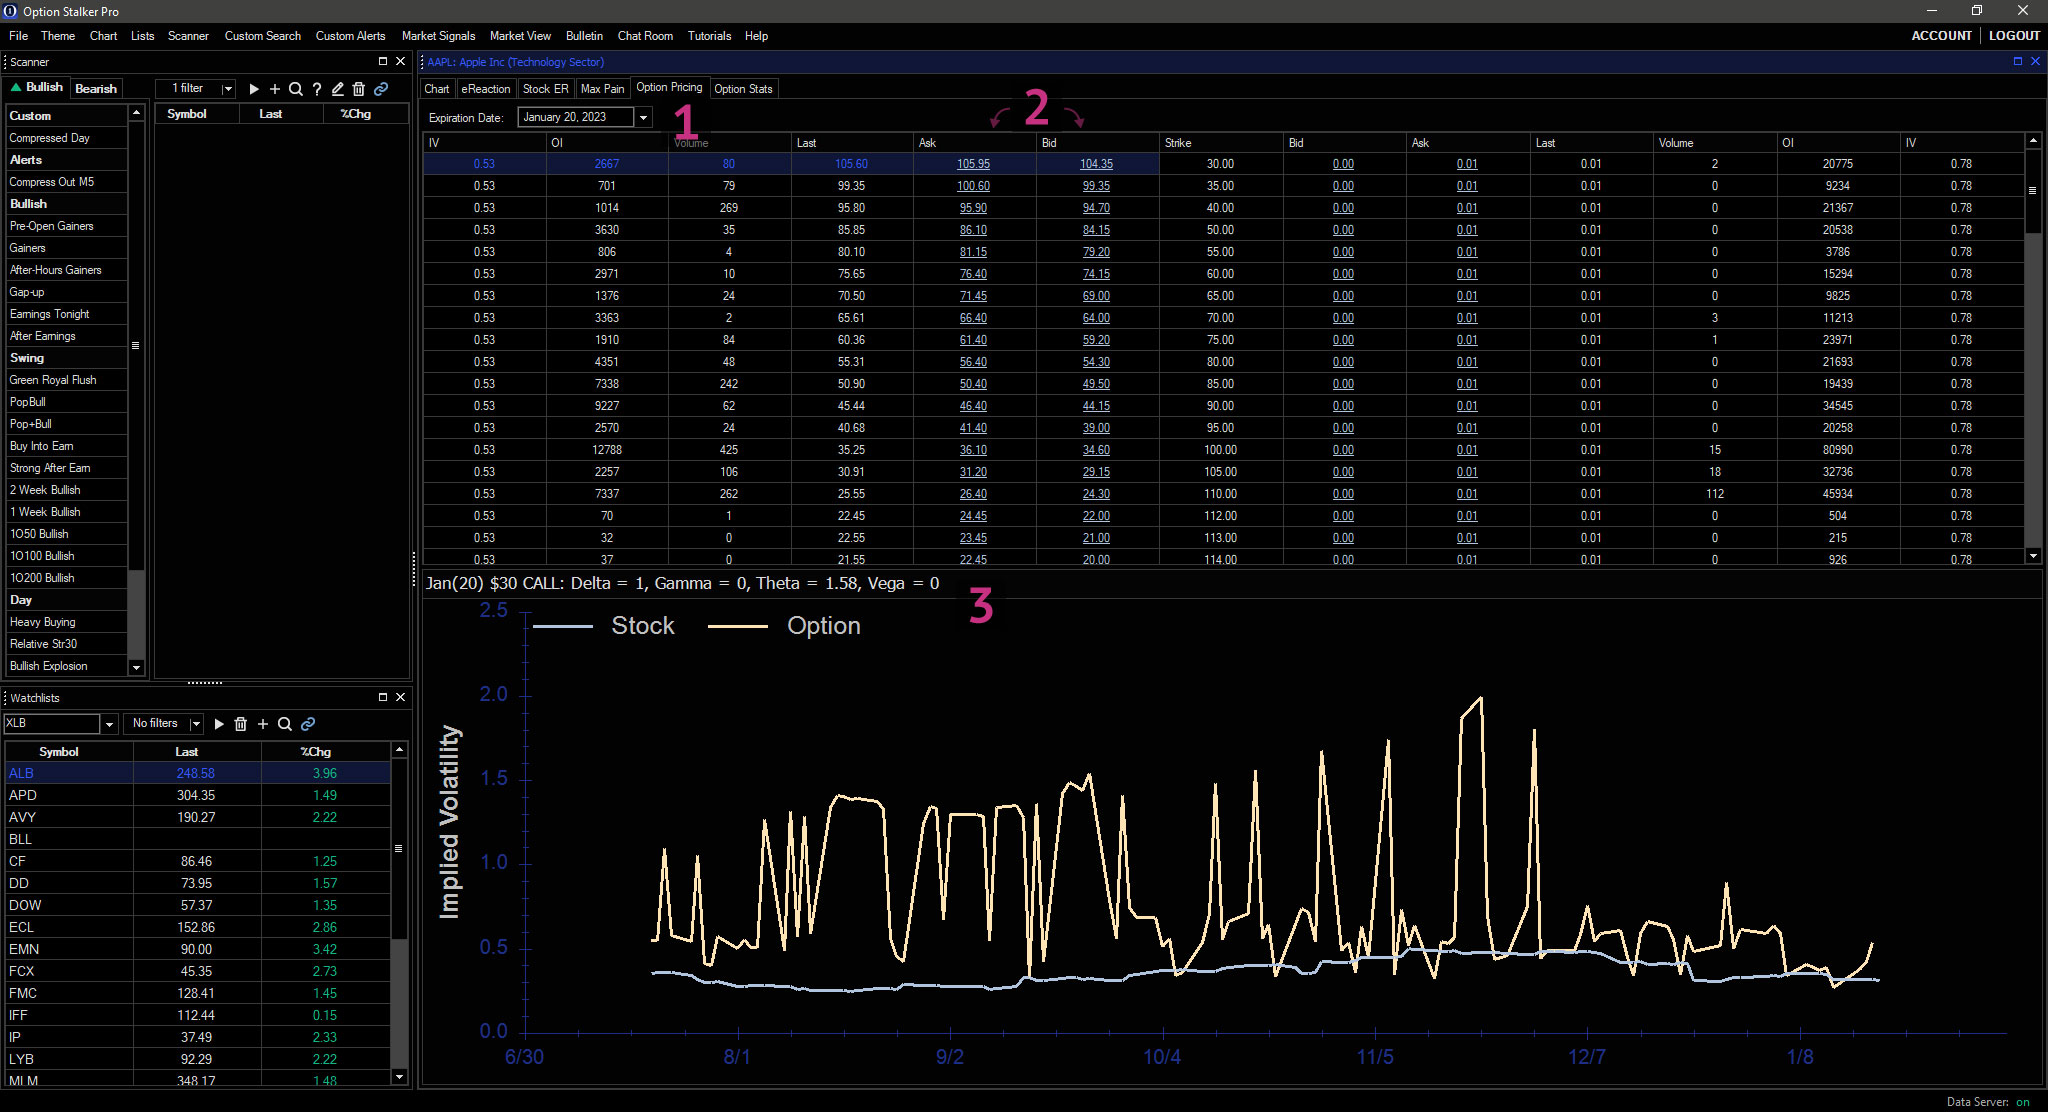
Data for the Option Pricing tab is updated after market close each day. It is effective for end-of-day analysis. Select the Expiration Date1 and click Bid or Ask2 to view the greeks, historical stock volatility and historical option implied volatility in the pane below.3
For real-time option chains, please use the Options Order Entry feature.
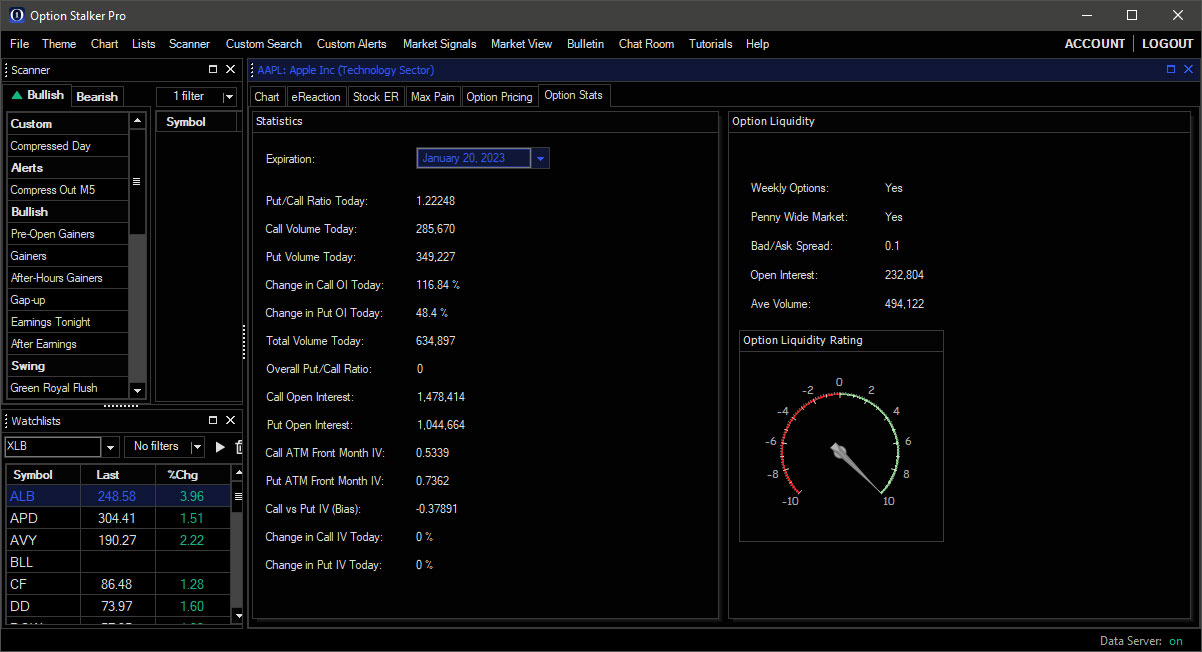
Option Stats
In the Option Stats tab, select the Expiration Date to view day-to-day changes in open interest, volume, and IVs, view Option Liquidity statistics, or view the rating.
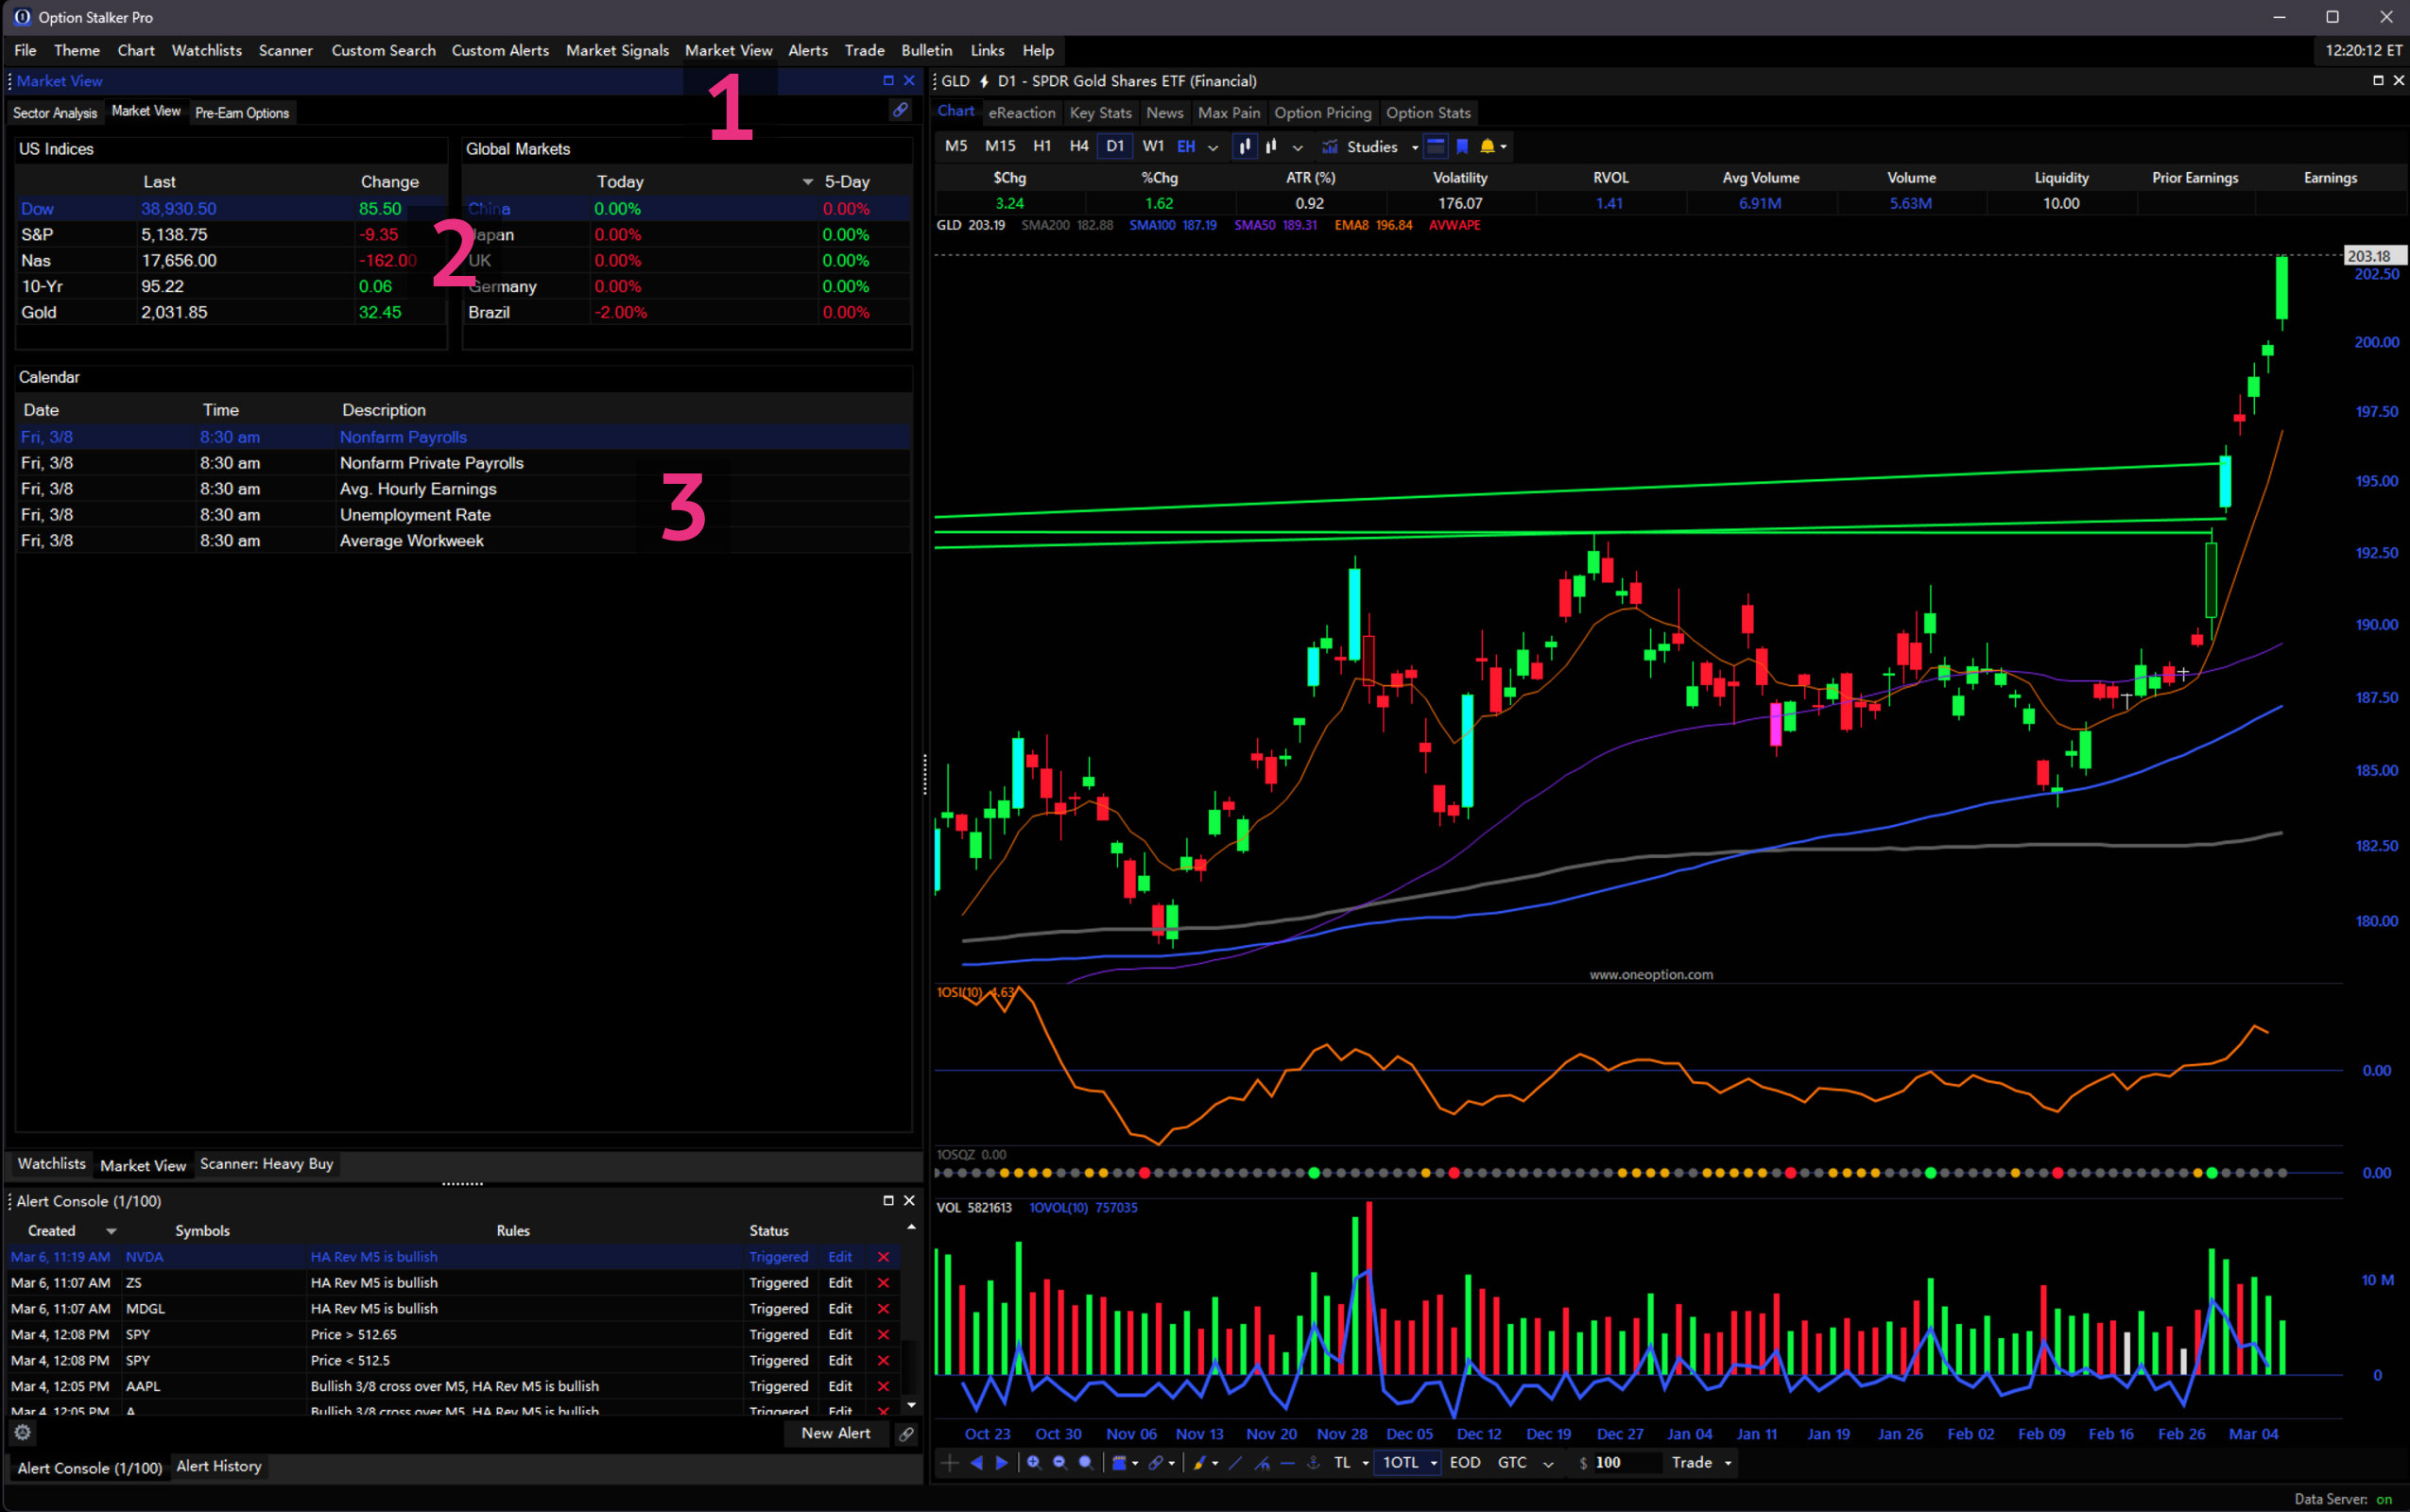
Market View
The Market View panel can be opened via the Main Menu1 and provides market-wide information and foreign market performance.2 Net change is calculated using the ETF for each index. Here, you will find a market calendar to track upcoming economic releases and other important dates.3
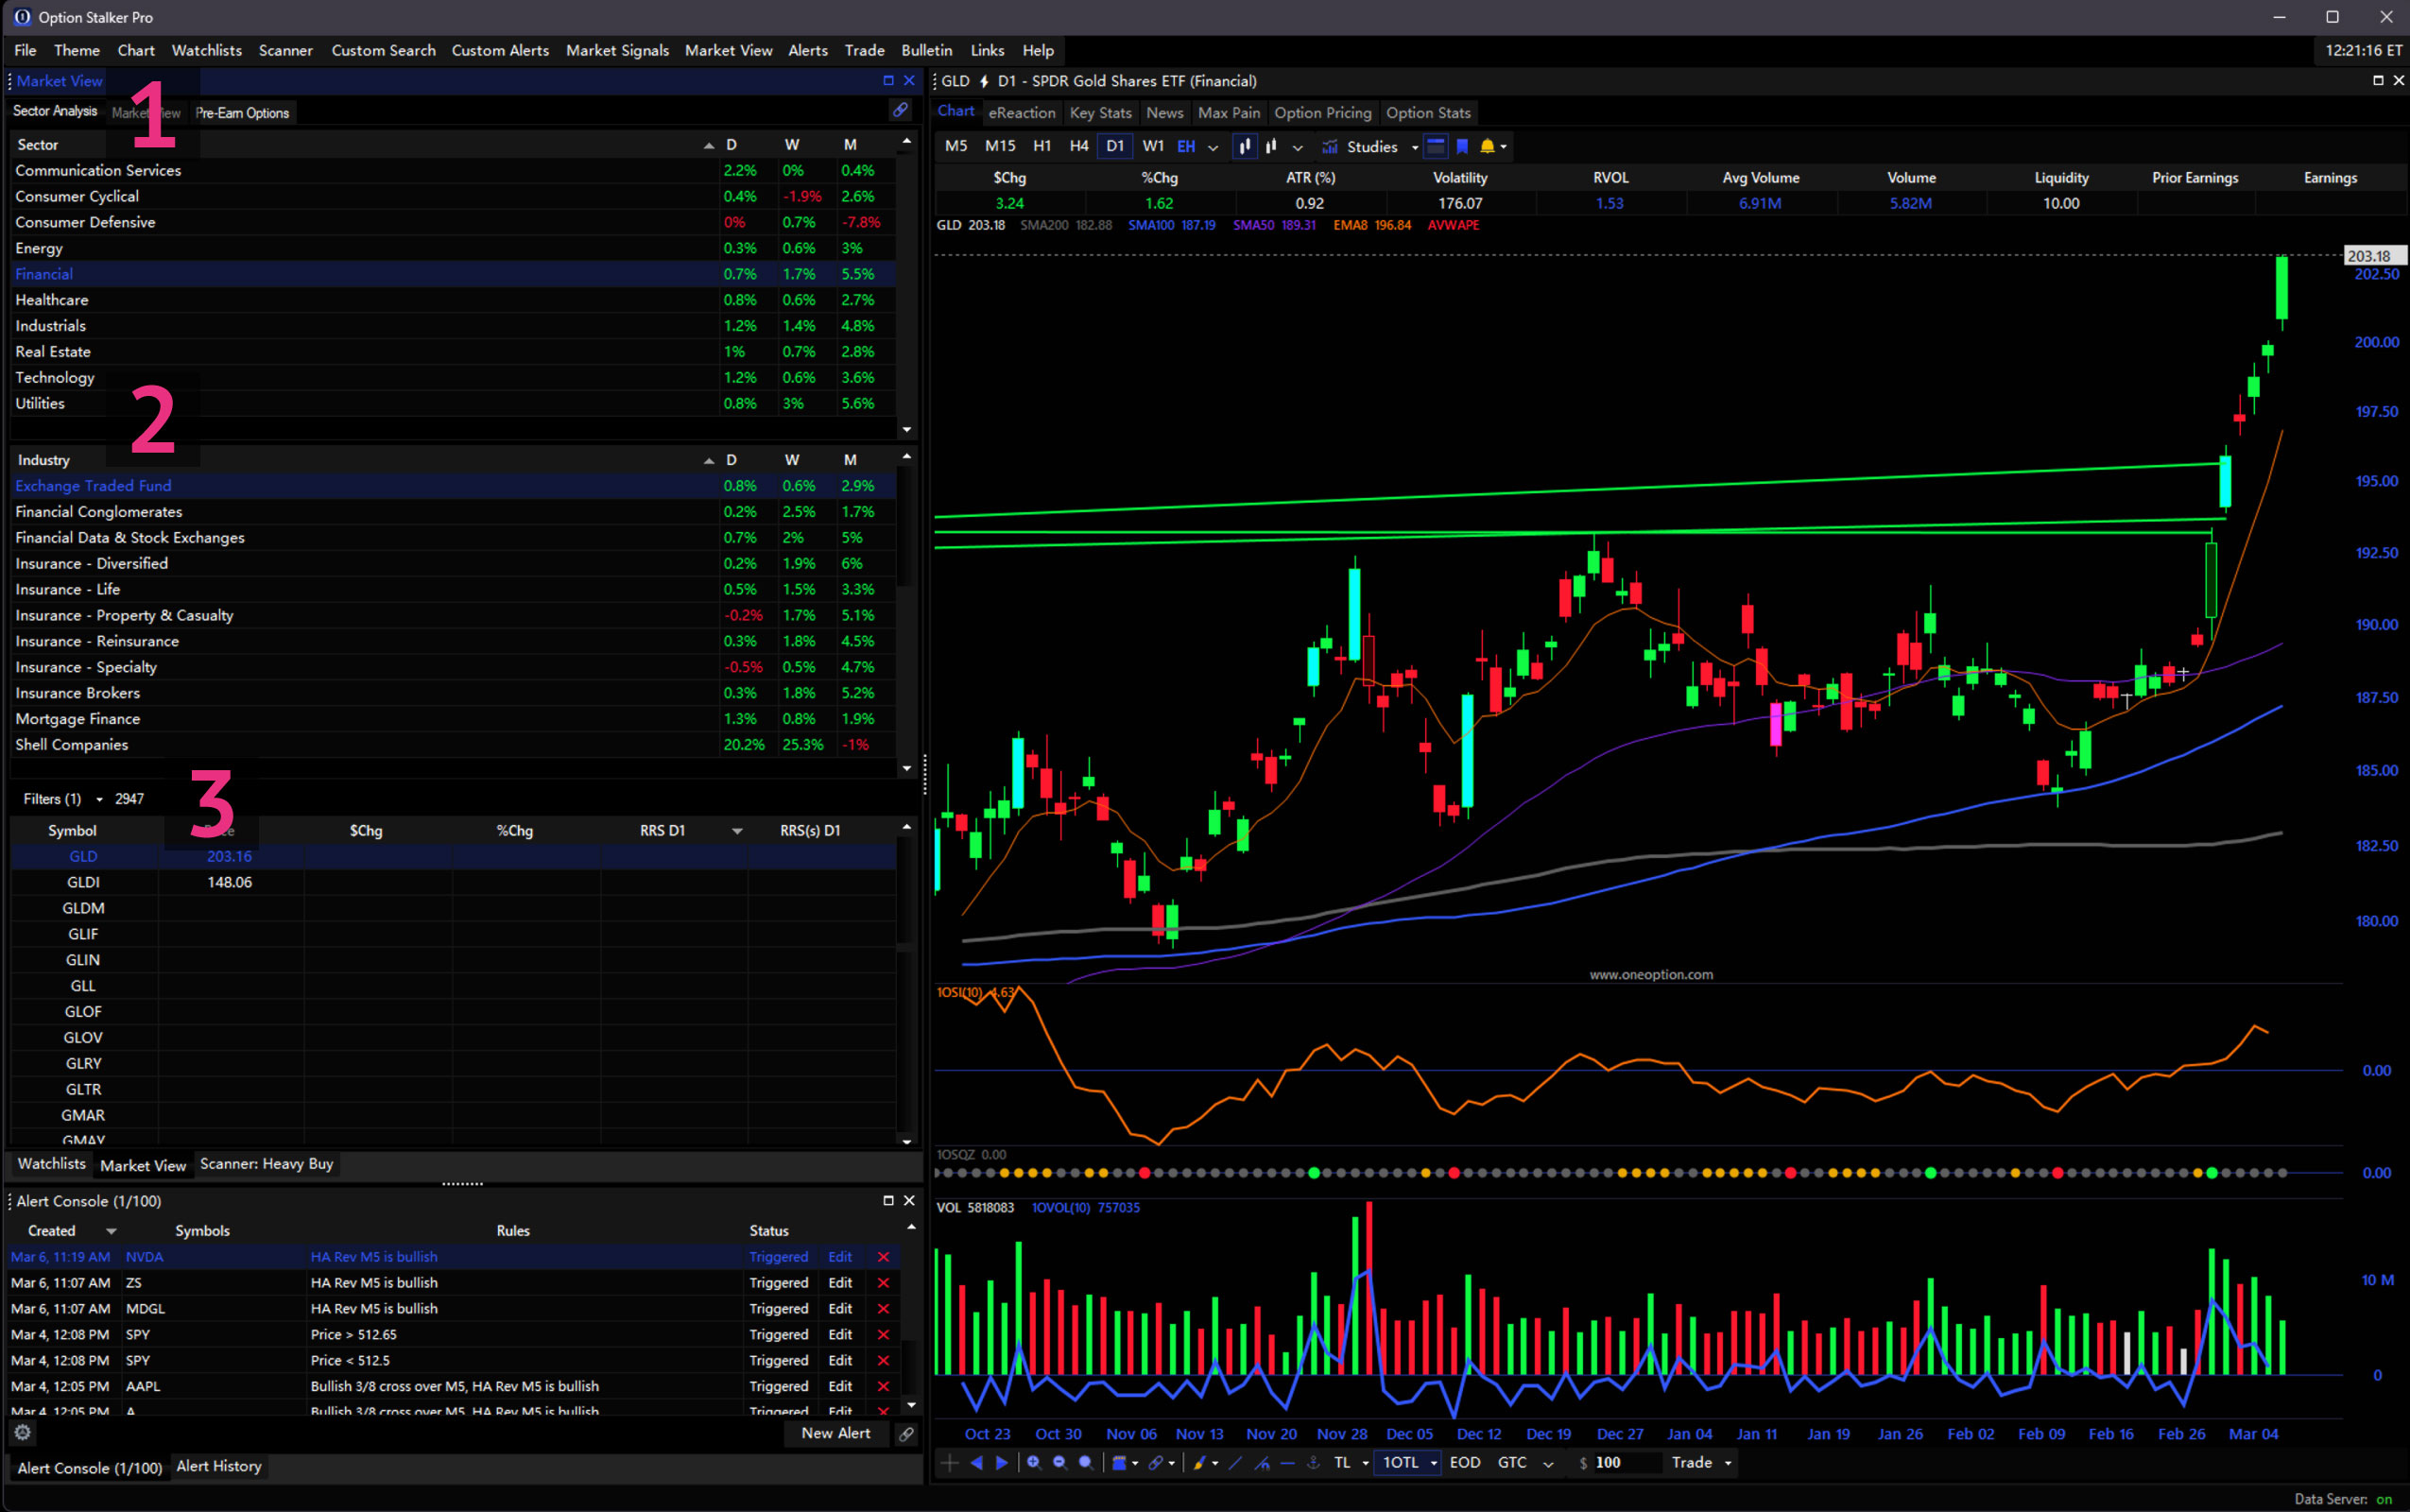
Sector Analysis
Within Market View, the Sector Analysis tab reveals % Change of each Sector, Group, and Industry within the market as calculated over the past day, week and month.1 This tool is great for top-down analysis. Click on the sector to reveal the groups and industries within it and view their performance statistics. Click on an industry to view its groups.2 Click any sector, industry or group to view its constituent stocks in the table on the right.3 Right-click the table to edit visible columns. The sector analysis tab can be linked using colored link groups so that any stock clicked will open in any chart of the same group.
Pre-Earn Options
This tab will list companies that will report earnings after the close today or before open tomorrow. The table lists the stock symbol, last price, net change, expected move (calculated on front month at the money premiums), average move % (based on the actual average move the last 12 quarters), the number of times the stock has exceeded the expected move during the last 12 quarters the recent stock volatility during the last 20 trading days, front month put/call ratio, stock performance from the same group after reporting earnings, open interest, front month at the money IV, and option liquidity rating.
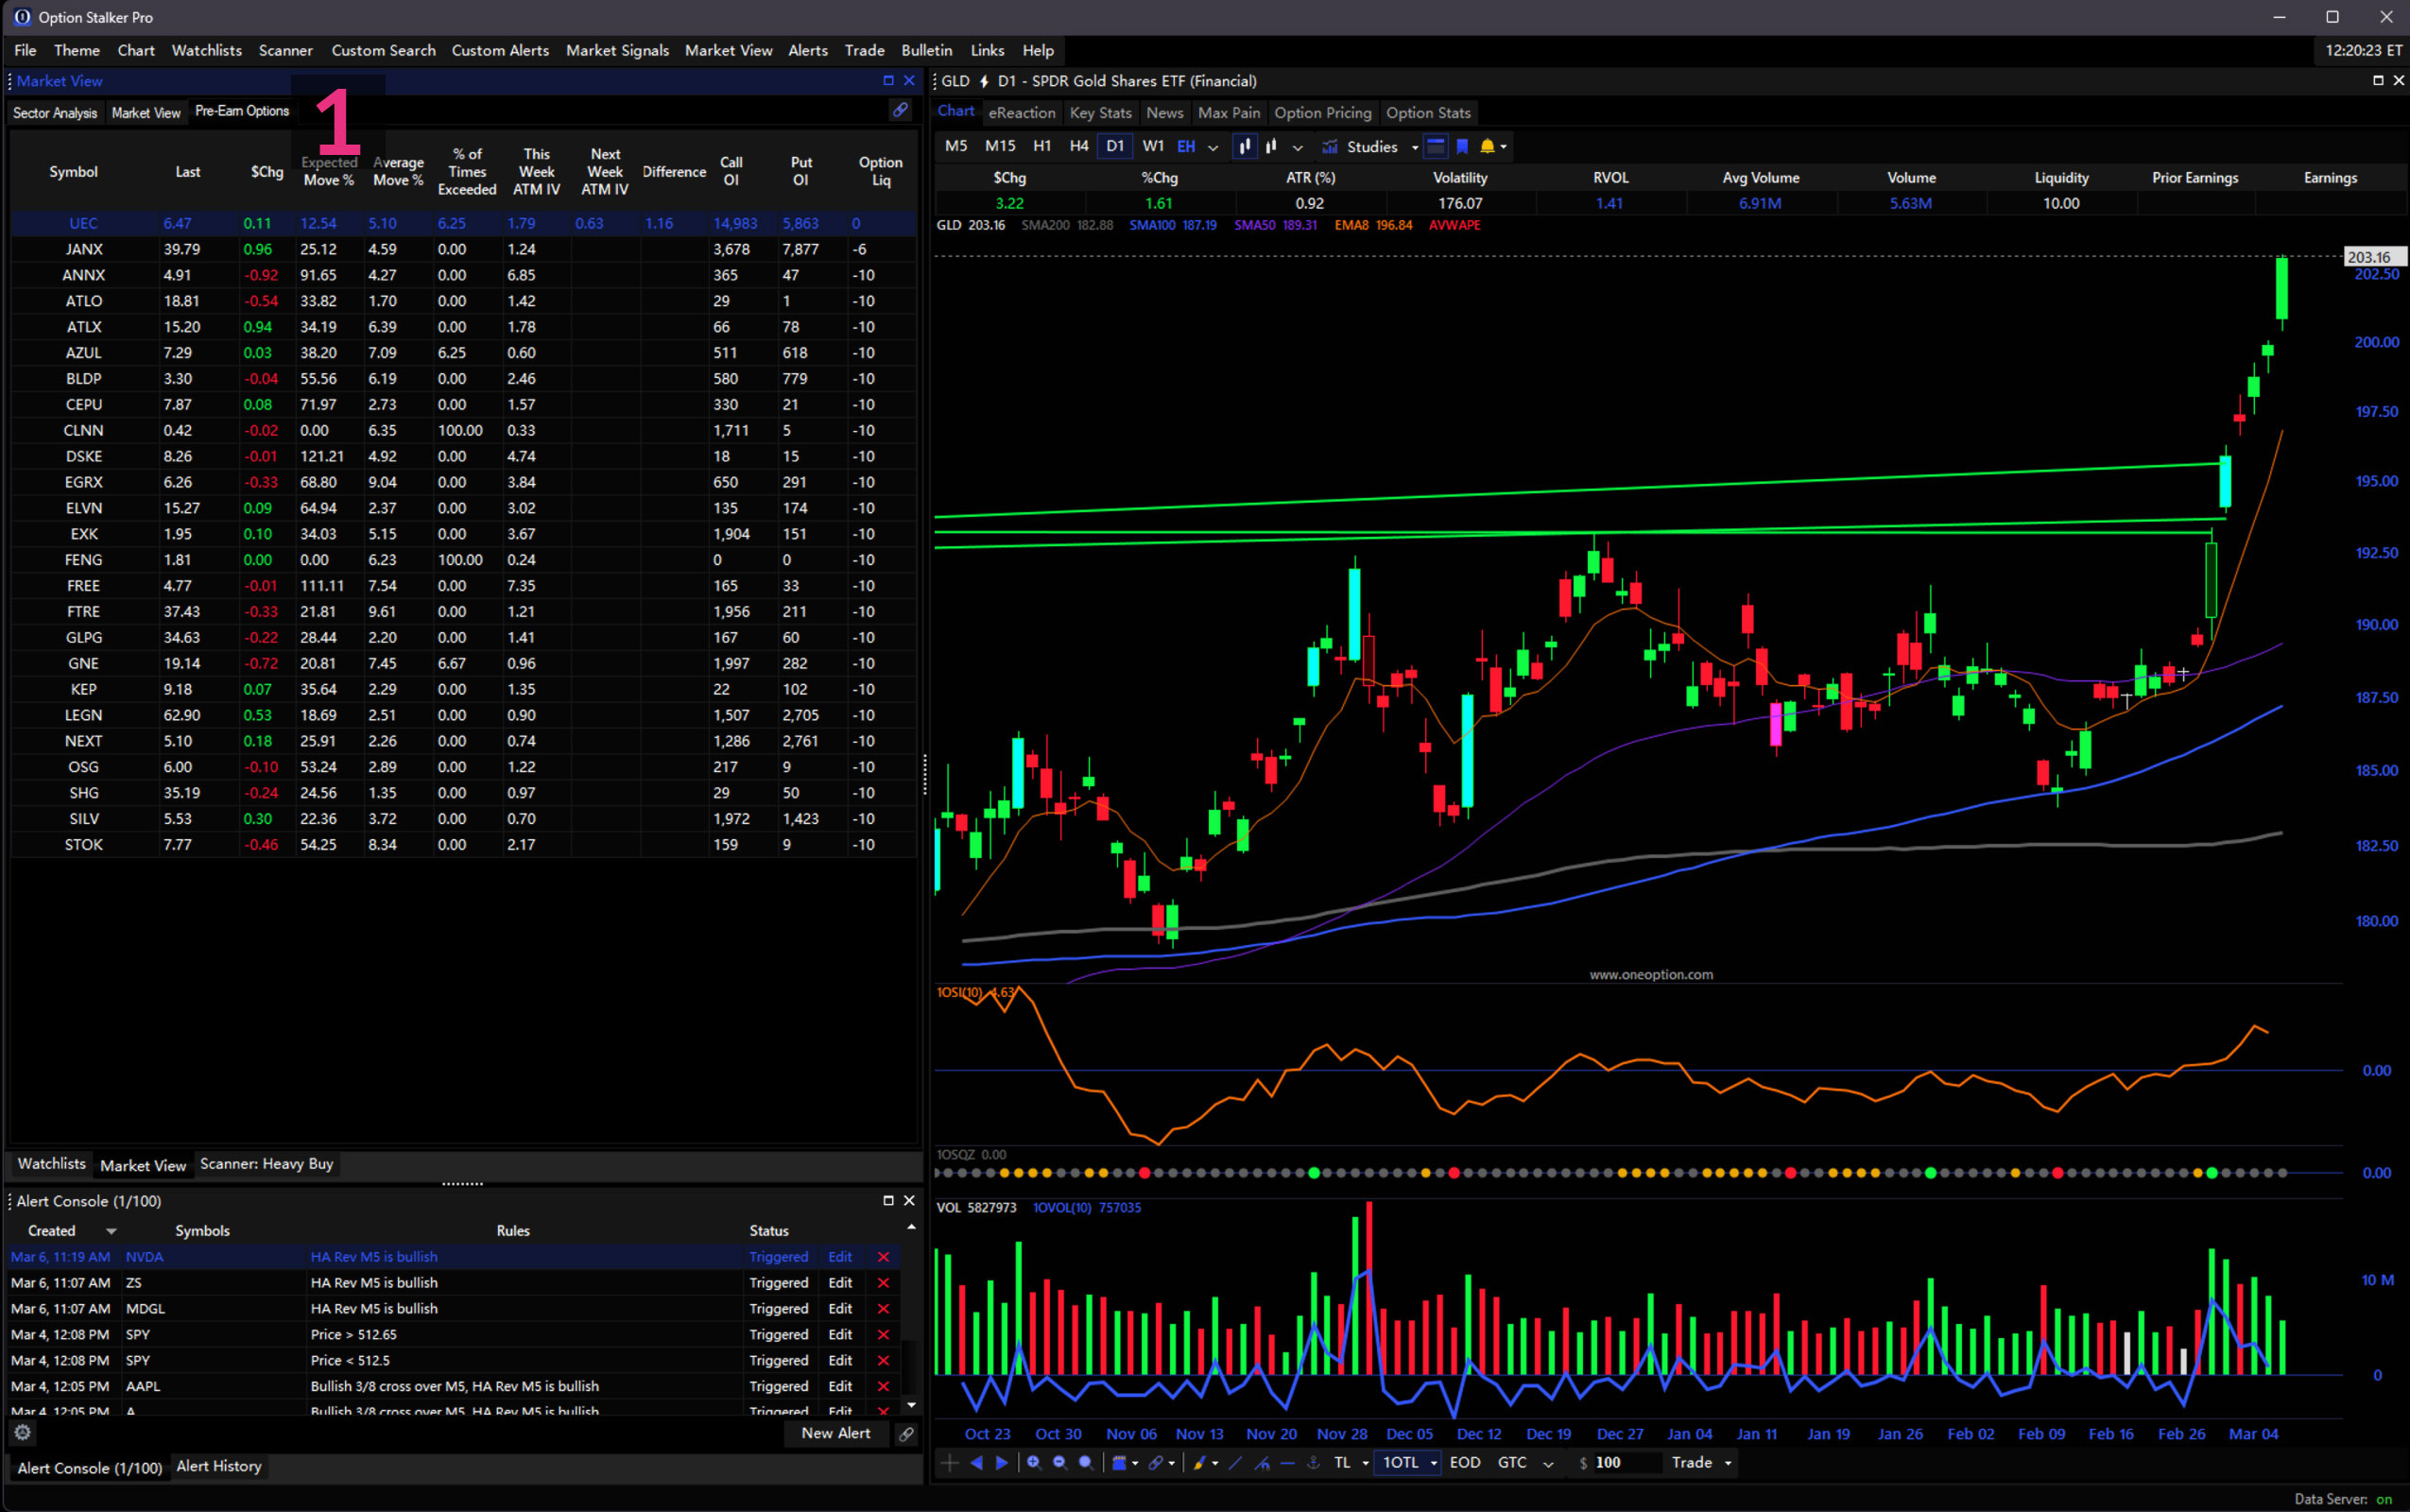
Strategy Idea: Earnings traders can sell straddles on stocks with high option IVs that rarely exceed expectations and buy straddles on stocks that have low IVs and that frequently exceed expectations.
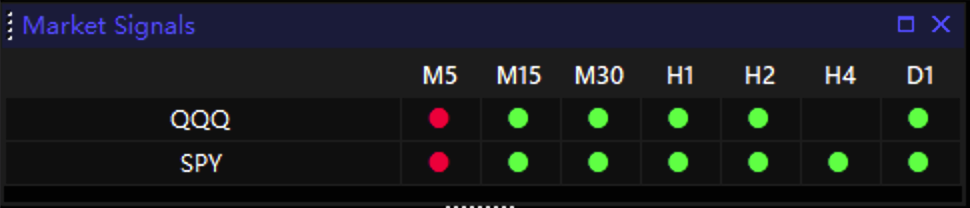
Market Signals
The Market Signals use the same technology as our Trade Signals. They provide context for market direction across multiple timeframes. Green indicates a buy signal and red indicates a sell signal. If the signals agree across multiple timeframes, the accuracy of the signals increase. This is a good tool for determining trade direction.
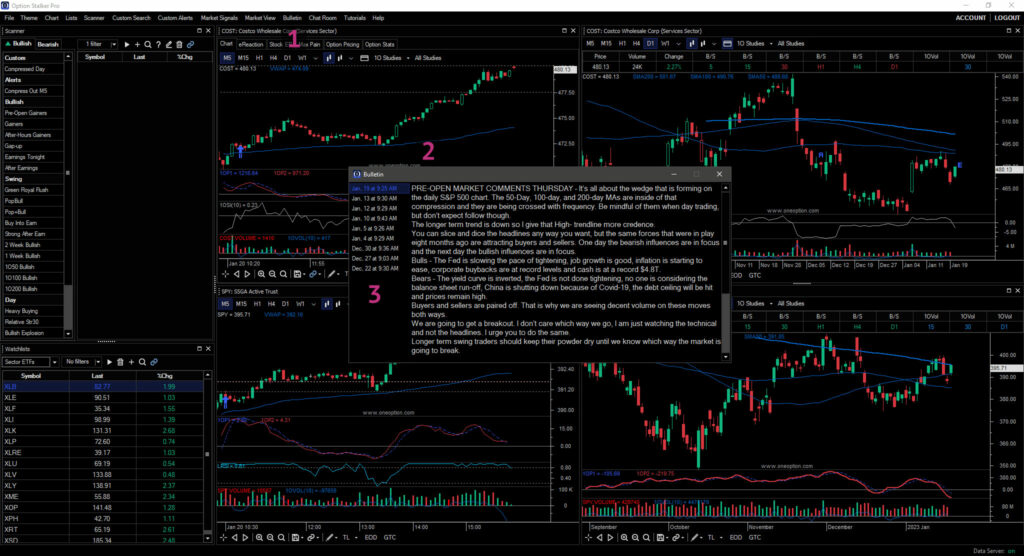
Daily Bulletins
The Bulletin button in the Main Menu opens the OneOption Pre-Open Market Comments.1 The Bulletin window will pop up automatically when OSP launches when something new has been posted.2 Click the list of dates on the left to view past bulletins.3
Chat Room
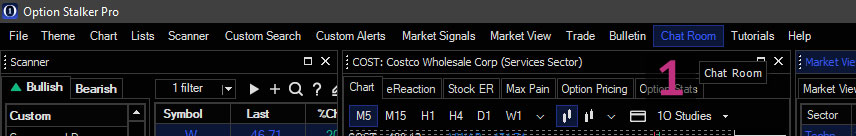
The Chat Room is where it all comes together and is included with an Option Stalker Pro membership. You can access it in OSP directly via the Main Menu1 or from your Account Dashboard. To learn more about the Chat Room, please visit the Chat Room Manual.
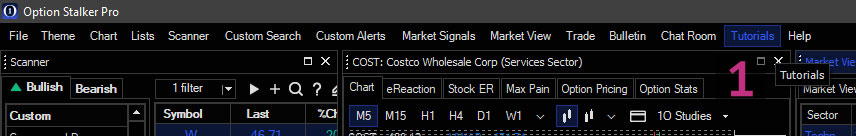
Tutorials
OneOption’s extensive library of educational videos describe OSP features, trade search techniques, market analysis, and trading strategies. We place a premium on education and all members to become better traders. Please visit this resource often. Your time spent on the Tutorials page and other educational materials will be worthwhile.
You can find more educational material in OneOption’s The System, Index and YouTube channel.
Support
Need help? At any time, visit our FAQ for answers to common issues. If you still need assistance you can click Help in the OSP Main Menu during market hours and we will help you through Live Chat. If we are unavailable please leave your email and we will contact you.