Originally written for r/RealDayTrading Jan 08, 2022
I have traded many systems and this is a legitimate concern. It is important to determine the nature of the edge and relative strength/relative weakness is here to stay.
My first public post about this edge (that I can find) was more than 15 years ago and I had been trading it many years prior. Relative strength and relative weakness is not a fad and that is why this sub will grow exponentially for many years.
CLICK HERE TO READ MY ARTICLE FROM 2006
Relative strength/relative weakness exists because institutions are buying. If you are a portfolio manager and you have to “place” $2 billion for a longer term investment (fund) you don’t care about the intraday wiggles and jiggles. If you are in charge of a company’s share repurchase program and you need to retire stock, you don’t care about intraday wiggles and jiggles. The fact that shorter term sellers (speculators, sell programs, baskets, HFT) are selling the stock works in the favor if the institutional buyer because they can get filled on the buy orders without driving the price up.
When the market drops and the stock does not, you know that large institutions are aggressively buying the stock. This trail of bread crumbs is impossible to hide. Prior to electronic exchange networks (ECNs) large institutions would tip their hand when they executed large block trades. In the age of electronic trading large institutional buyers tried to cover their tracks by breaking large block trades into tiny 100 share orders, but the relative strength/relative weakness indicator was not fooled.
Yes, but what about dark pools? It doesn’t matter where or how the trade is executed. If dark pool buyers exceed dark pool sellers, that imbalance will instantly be reflected in the current price of the stock. An institution is on the other side of that dark pool trade and they will act on that information. If the institution was an aggressive seller, they will place another order to see if they can get filled on more. If the buyer is gone, they may offer the stock lower (bearish). If the institution on the sell side is not aggressive, they will raise their offer (bullish) on the notion that there is a big buyer. For every buyer there is a seller, and supply/demand is disseminated instantly in the form of price.
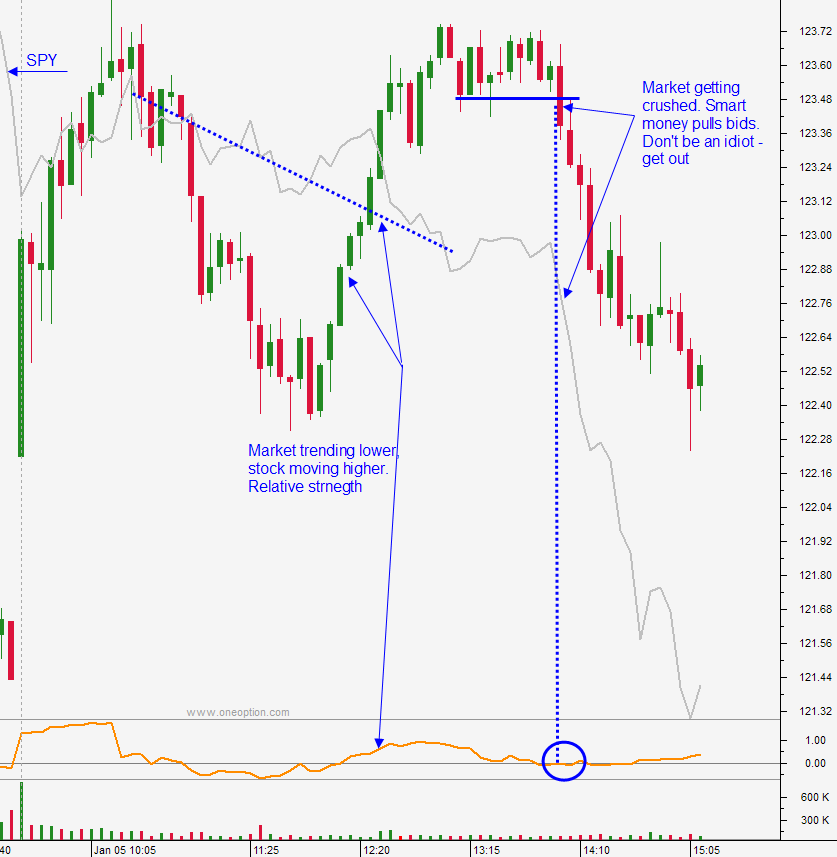
“Yeah, but I bought a stock with M5 relative strength. The stock looked great when the market was going down and then it caved in. This edge doesn’t work!” Very few stocks are going to tread water when the market drop is big and the trend is sustained. When you see the market tanking you need to monitor the stock very closely. If the stock starts to show signs of weakness and the market is stacking red candles (bearish trend) you need to get the hell out of the trade. You were on the wrong side of the market and when the bid started to slip, relative strength provided you with a momentary cushion. It allowed you to be on the wrong side of the market without getting crushed. Institutional buyers aren’t stupid. When they saw the market tanking, they pulled their bids feeling that they could get filled at a better price and that is why the stock dropped. In some instances, stocks will hold the bid even when the market has a big drop and that is a sign of pure strength. The buyers are undeterred and those are some of the best longs.
If you are in a stock with fantastic relative strength on M5 and D1 and the market is drifting lower with mixed overlapping candles (weak trend) and the market is still above the low of the day and the prior day’s low, you might be able to hold the position and weather the storm on the notion that the market drop is temporary. Just make sure the stock is holding up well (EMA8 preserved, green flat bottom HA candles, up trendlines intact…). When the market does find support, you want that stock to take off.
It stands to reason that relative strength on a D1 basis is more relevant than relative strength on an M5 basis. That is why we look for longer-term strength in the stock to support our day trades.
I built an entire trading platform around this edge during the 2008/2009 financial crisis and it is working as well as it did the day the first line of code was written.
In the five-minute chart below you can see how well the stock held up during the 100-point S&P 500 drop. This stock had D1 relative strength, but eventually buyers pulled bids and it dropped. In the last two days, the market is right at that same low, but the stock just made a new all-time high.