In today’s option trading blog I’ll continue my fundamental analysis of a stock that’s on the move. I’ve already taken a look at the current news and the most recent earnings release. Now I’ll take a look at the financial statements and the macro environment for the company.
When I look at the financial statements, I start with the Income Statement. I want to see at least 3 years of historical data. I start with the top line growth and I want to see revenues that are steadily increasing year-to-year. As I move to the bottom line, I look at operating margins and I determine if the company is able to control expenses. An easy way to do this is to compare the annual operating margin percentages. Finally, I look at the EPS (earnings per share). One of the more important ratios I consider is the current and 1 year forward P/E ratios. I compare them to the industry and the S&P 500. There are times when a high growth company is valued on expected earnings growth and in that case I will also look at the PEG ratio. It divides the P/E Ratio by the Expected EPS Growth Rate. If the stock is a “high flyer” I want to see a number less than 1.5 before I will consider getting long. I try to stay away from stocks that don’t have much history or information. They are harder to value and tend to be much more volatile. Established companies with a history are much easier to predict.
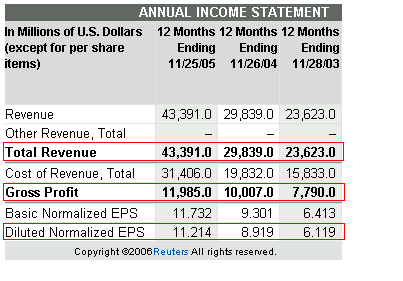
Here is an example of a nice stock. This company has consistently grown revenue over the last 3 years. The profit margins are intact and that has translated into very consistent earnings growth. I like to look at the diluted earnings per share because it accounts for stock option grants. If a company is able to grow earnings but it can’t bring the profits down to the bottom it could be signaling a number of things. Lower margins due to price competition, higher labor/production costs and/or mismanagement are possible causes. If the company has been able to improve the bottom line, but the top line is flat it could be signaling a loss in market share or a decrease in demand. The company has preserved the bottom line through cost cutting. Neither situation is favorable for a prolonged period of time. The company below is Goldman Sachs (GS). It is one of the premier financial institutions in the world and it has been a favorite long of mine.
When I look at Balance Sheets I want to see liquidity. A strong cash position and very little debt tell me the company has flexibility. It can buy back shares, acquire a competitor, develop a new product line or reinvest in plant, equipment and R&D. The debt loads vary by industry and I advise comparing the company’s Balance Sheet to its peers. One measure I use subtracts Total Liabilities from Current Assets. This gives me an idea of where the company stands without its long term assets. Those assets are difficult to value and if you remember WorldCom, the company was trading at a discount to book value. That was because they were amortizing expenses and counting them as assets. This area of the Balance Sheet (Long Term Assets) can hide items so I choose not to include them in my analysis. In some cases, I will find a company with a mountain of cash and I back out the liquidity per share when I calculate the P/E. The company below provides a nice example. It is a small, highly specialized company in the semiconductor industry – Cabot MicroElectronics – CCMP.
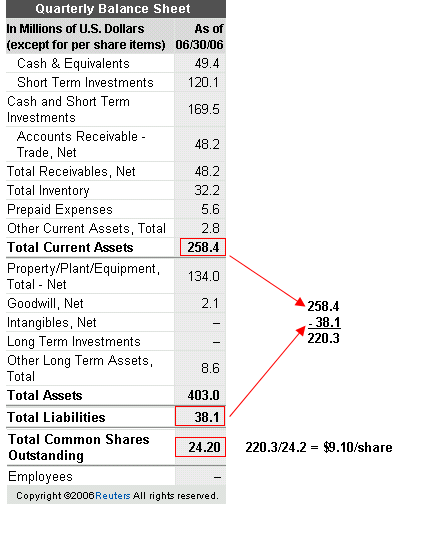
The company is slated to have fiscal EPS of $1.43 (Sept 2006) according to Yahoo Finance and that yields a P/E of 19.9. That’s fairly rich. However, if you backed out the $9 it has in liquidity from the stock price, you would have a P/E under 14 ($20/$1.43). Now the stock looks cheap. I do actually like this stock and I’m often long when the semiconductors are rallying.
The last part of my fundamental analysis looks at the macro environment for the stock. This is ongoing research and I conduct it by reading – everything. It incorporates economics, politics, consumption trends, competition, barriers to entry. This is more of an awareness than anything else. I want to know that a company has a competitive edge that they can “work” for a long time to come. I enjoy reading Barrons and I have found it to be a great resource. Here’s a current example of my macro research.
For the last five years, China has been increasing its oil consumption by 25% annually. They are now the second largest oil consumer in the world. They have no domestic reserves to speak of and it all has to be imported. Do you see this trend changing – I don’t. I think they are just getting started and they are in the market to buy oil producers. This also does not take into consideration oil consumption in all of the other emerging markets globally. The barriers to entry are very high due to the extraordinary cost of exploration. Deep water oil rigs are contracted three years into the future and they are in short supply. Many oil producing countries are politically unstable and supply disruptions are common. The industry is consolidating and oil producing companies are acquiring other producers and buying back shares. They see the supply/demand imbalance and they think their shares are cheap. At P/Es under 10 – so do I. A stock that has been coming up on my searches is Marathon Oil – MRO.
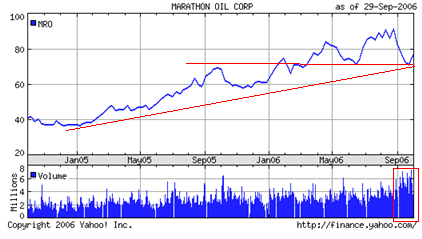
This stock is in a 2-year up trend with 1-year support at $70 and a 1-year forward P/E of 7.4. This one might be worth a look. There are many similar opportunities in this sector right now.
Now that the fundamental analysis has been conducted, my daily efforts yield at least one great bullish and bearish pick. I have not talked much about the bearish side of the equation, but my analysis is the opposite of my bullish research. These two stocks go into my watch list. Some will get immediate play but the vast majority will be monitored for a few days.
In the next option trading blog, I will show you what I look for once a stock has been “tagged”.