Market Will Try To Confirm This Technical Pattern
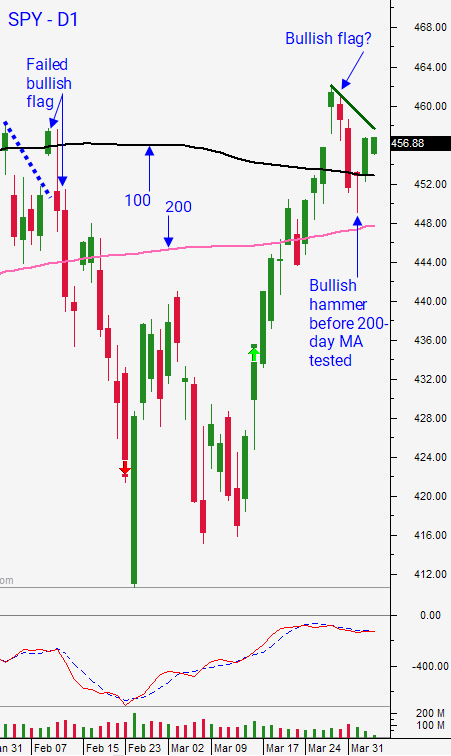
Posted 9:30 AM ET - The market has been strong since the FOMC statement in March. It has rallied above the major moving averages and it has been able to hold those levels. Last week we saw a round of profit taking that ended very quickly and that is a bullish sign. The SPY formed a bullish hammer above the 200-day MA and it rallied back above the 100-day MA yesterday. A bullish flag formation on a daily chart will be confirmed if the SPY closes above $458.80.
The domestic economic data has been good. Today we will get ISM services 30 minutes after the open. Last month the number dropped considerably so let’s see if it can recover. The service sector accounts for 80% of our economic activity and I consider this to be an important number. It is a survey, and as such it is current.
Tomorrow the FOMC minutes will be released. It will reveal the details from the last Fed meeting. According to the Fed Chairman we should not see any surprises. The price action has been fairly dull intraday and we could be in for light trading until this release.
Earnings season is only a week away and that typically attracts buyers.
Swing traders that have a trade duration of 3-4 weeks should use this guideline. The price action has been strong the last few weeks and support is building. End-of month/beginning of the month fund buying has run its course. Let’s see if the SPY has enough gas in the tank to confirm the bullish flag ($458.80). If it does, I would be inclined to start selling out of the money bullish put spreads. We need to wait for that confirmation. There was a bullish flag formation on February 9th that also looked good and that breakout failed. We made a lower high double top and the next leg of the market sell off began. If we see similar selling pressure, we will wait for support and that drop will provide us with an excellent entry point ahead of earnings season.
Day traders should favor the long side. On an H1 chart you can see that the bullish flag has been confirmed. 1OP will start the day off on a bullish cross and we could see stacked green candles on the open. This is a fairly likely scenario (30%). I don’t want to chase, but if you have stocks with excellent relative strength, heavy volume Monday and D1 technical breakouts that are opening well, I think you can buy early if you see stacked green candles. The better scenario is a flat to slightly lower open. I also feel this is likely (35%). Buyers defended the 200-day MA rigorously and that is bullish. I don’t believe we will see sustained selling until resistance is confirmed. Another likely scenario is very compressed trading and an “inside day” ahead of the FOMC minutes. Keep an eye on ISM services at 10:00 AM ET.
Support is at $453.50 and $450. Resistance is at $458.80
.
.
Daily Bulletin Continues...