Big Market Gap Higher – Here Are the Patterns To Watch For Today
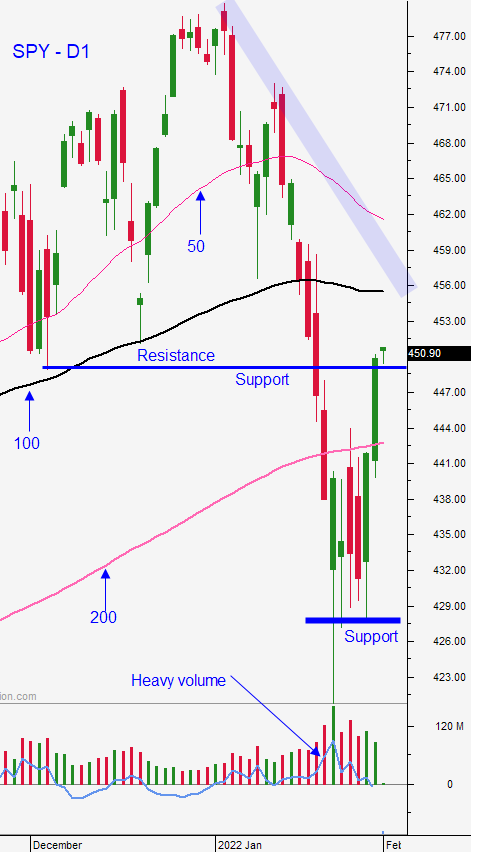
Posted 9:30 Am ET - The market tested support at SPY $430 multiple times a few weeks ago and it rallied off of that level. The 100-day MA provided resistance and the market retested support at the 200-day MA this week. Buyers are more confident now that the S&P 500 has formed a double bottom higher low and the futures are up 42 points before the open.
From a technical perspective I have a slightly bullish bias for the next week. The downward sloping H2 trend line at SPY $453 will be tested this morning and we should open above it. There is also a D1 downward sloping trend line at $456 and that coincides with the 100-day MA. That will be a formidable resistance level. The recent market volatility will not go away quietly and I believe the SPY will trade in a range between the 100-day and 200-day MAs.
The House passed a short term funding bill so that the government doesn’t run out of money before the February 18th deadline. Now the Senate will vote on the bill and this will buy us a whole month (March 22nd) before we have to address it again - ridiculous.
Swing traders should have a full SPY position on from the $435 level. We are using the 200-day MA as our stop on a closing basis (the index has to close below this level and we check the price 5 minutes before the close). We are well above that level and the first target is SPY $460. Selling out of the money bullish put spreads is a good strategy, but I would not rush to add them on the big overnight gap up today. We will have plenty of dips before the FOMC meeting in March so wait for them.
Day traders should not rush in to buy the gap up today. If we see stacked green candles with little to no overlap (20%) the market will grind higher for an hour and compress the rest of the day just below the 100-day MA. This would be my least favorite pattern. I don’t believe it will play out because of the recent selling pressure we’ve seen. Asset Managers needing to reduce risk will take advantage of the opening gap higher. Consecutive stacked red candles with little to no overlap are possible (20%). That would be a gap reversal and I would short that pattern. It would be a sign that much of the gap will fill before we find support. The best pattern for us is a choppy drift lower with mixed overlapping candles (40%). Support will be tested and that will buy us precious time to search for relative strength. This price pattern will also be a sign that buyers are engaged because the trend strength will be weak. If this process lasts less than an hour and the retracement is minor (20 points) we will have a nice opportunity to get long early in the day. If this bid check takes longer (2 hours) and the retracement is deeper, it will be a sign that the selling pressure is still fairly heavy. In this scenario you have to wait longer.
Support is at the 200-day MA and the close from Tuesday. Resistance is at $453 (we will open above it) and the 100-day MA.
.
.
Daily Bulletin Continues...