Market Forming Support – Watch For This Tell Then Buy
Posted 9:45 AM ET - The market has formed support and the FOMC statement is behind us. Earnings season is in high gear and that will be the focus for the next two weeks. This is a bottoming process and the market is forming support.
From a fundamental standpoint, money has to go somewhere and there is a ton of it out there after all of this money printing. Bond yields are still at historic lows and fixed income is producing negative real returns (yield – inflation < 0%). Where is all of that money going to go? Corporations continue to buy back shares aggressively. They are selling cheap debt (bond offerings) and they are using the proceeds to buy back shares. AAPL has repurchased 25% of its shares outstanding in the last 5 years. More cash from money printing, few alternative investments and less shares to buy = higher prices. These are incredible forces. My thesis is that the market is going to establish a range this year and it will spend time in that range while earnings/valuations catch up. I believe we are currently at what will be the low end of the range and this is where I want to start buying.
The FOMC press conference was in line with expectations and we can expect a rate hike in March (.25%). Even if interest rates increase 1% this year, they are still near historic lows and this is accommodative. Here is a major “tell” that tells me the selling pressure will remain steady for the next week. After a major event like the FOMC statement we typically see option implied volatilities (VIX) contract. The news is out and that “uncertainty” is gone. Institutions have been selling volatility aggressively the last few years because the Fed (through loose monetary policy) has provided market support (Fed put). By historical measures the Fed is still very accommodative and the VIX should have dropped after the statement, but it didn’t. Yesterday when the market rallied early in the day VIX should have been crushed and it wasn’t. Asset Managers still see danger ahead and they are buying protection (long VIX or long puts) and that is driving up option premiums. This is a short-term bearish sign.
This morning the PCE came in a little “hot” and inflation is at a pace that we have not seen since 1983. That is no surprise. Earnings have been very solid, but with valuations being high on a relative basis, that news is not sparking interest (buying).
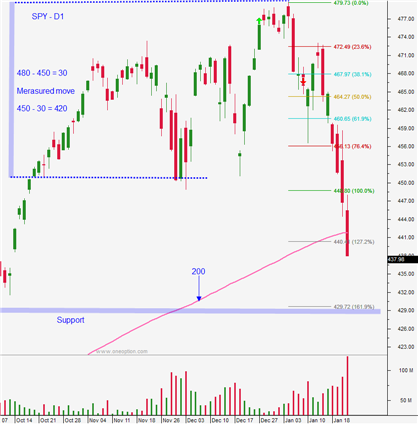
Swing traders are long a ½ position in SPY. We are waiting to add the second half and you should use this guideline. If the UVXY closes below $16, buy a ½ position in SPY. We are only going to use this method today (unlikely). When this happens I expect the SPY to rally above the 200-day MA. We need confirmation that the base has formed and this is a bottoming process like the one we saw in October and December where we had multiple tests of support before buyers stepped in.
Day traders should expect volatility. The market has been making big moves in both directions. Overseas markets were generally weak overnight and that will be a drag. Because I am looking for a swing entry point for longs at this level, I prefer to trade from the long side. I will be watching UVXY very closely. When the market is flat we want UVXY to start drifting lower. When the market is up, we want it to get crushed. When the market is down, we want very sluggish upward price movement in UVXY. If we see all of these reactions, we will know that SPY support is forming. If UVXY remains steady and it moves higher with ease, we know that Asset Managers are still in risk off mode. Expect two-sided price action and use 1OP and UVXY as your guide. After strong directional moves, take gains and expect reversals. We have touched SPY $429.50 a number of times recently. Sell stops are just below that level and programs will try to trigger them. I believe we will poke below that level to see what’s there today. If you are short before we test that level you can hold the short to see what happens. If you are NOT short before that long red candle, you must wait. If the candle reverses instantly (next 2 bars) we know that it was a head fake to trigger those sell stops and that we will rally back into the range. In all likelihood, we will see follow through and a nice bounce as short sellers get squeezed. This would be a bullish pattern. If we have follow though (more red bars) on that breakdown we could be headed for $420 next week. I am more bullish than bearish, but I will try not to let that bias affect my trading decisions.
Support is at $420 and $429. Resistance is at the 200-day MA and $444.
.
.
Daily Bulletin Continues...