Big Market Drop – This Is the OMG Air Pocket We Need – Watch For This
Posted 9:30 AM ET - The S&P 500 closed firmly below the 200-day MA yesterday on heavy selling pressure. Asset Managers are taking risk off before the FOMC statement this week. They are not going to buy until they see a capitulation low and here’s what it will look like.
Early in the day we will see a series of long red candles stacked on a 5 minute chart. The selling will be relentless and it will feel like the market is never going to rally again. At the darkest hour, the longest red candle on a new low of the day will reverse at the last second and that candle will close near its open (high). That will result in a bullish hammer. The very next candle (not a candle 3 bars later, the very next one) needs to be a giant green candle. Then you need to see 4-5 more just like it. Very little overlap for each candle and no dojis. When you see this intraday pattern you will know that the short term low is in and that you can sell out of the money bullish put spreads. We want this pattern in the first 3 hours because that will give buyers the rest of the day to rally the market back to the opening price and perhaps into the gap.
Until you see this pattern you should assume that the market is going down.
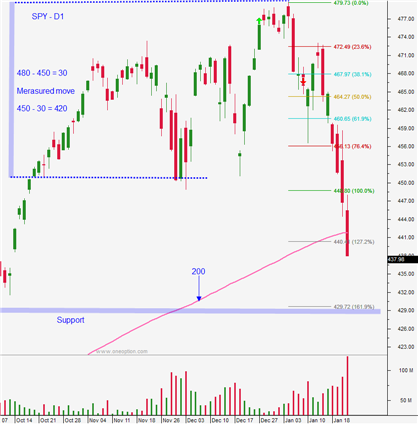
When will we see this selling climax? It could be today. The market has priced in a 95% chance for the first rate hike at the March FOMC meeting and traders will be watching for that confirmation Wed when the statement is released. Base on a Fibonacci extension and horizontal support I believe that we could see support at SPY $429. The next target below that is $420 and that is calculated using a measured move from the prior low to the all-time high.
How should I trade a capitulation low that is exactly like I described? I like selling out of the money bullish put spreads to take advantage of high option implied volatilities. This strategy also takes advantage of time premium decay.
Can I sell them on SPY/SPX? Yes, but I would make sure that you sell them below the low of the day when that reversal happens. That low is also likely to hold, but it could be tested a second time.
Swing traders with bullish put spreads that are in trouble, you have a few alternatives. 1. If the stock is still above technical support and it is still strong relative to the market you can try to weather this storm. We were keeping these trades short term and they should be expiring this week or next. 2. You can roll the spreads down and out. Buy the put spread back and sell farther out in time and farther out of the money for the same debit you paid to buy the spreads back. This can be entered as one trade with 4 legs. 3. You can try to leg out, but you need to have weakness in the stock and weakness in the market at the same time. I would not try to do this on the open because of the big drop and the potential for a big bounce. Look at Friday’s chart. The time to leg out of a spread was on that SPY bounce that started to roll over. If the stock was also weak relative to the market then you would buy the short put back and set a target equal to that purchase price for your exit on the long put. 4. You can day trade weak stocks to offset some of the losses on your bullish put spreads. This will provide a hedge. Of these alternatives, legging out is the riskiest and it requires the most skill. I believe that the actual FOMC statement is going to be as “dovish” as the Fed can make it. Earnings should be good and that will help the market find support this week. I do have videos on how to leg out of spreads in Tutorials, but the time to watch those was last week.
Day traders, look for more downside today. Until you see the pattern mentioned above, favor the short side. If we see that selling climax and that bullish hammer and stacked green candles, buy SPY/ES. I would not buy SPY calls naked. IVs are too high. You can sell put credit spreads to finance call debit spreads. You do need to be short premium to take advantage of the IV crush when we bounce. You can also just buy stocks with relative strength. You can also buy SPY calls and short VIX. There are a bunch of ways you can play the bounce once we have that capitulation low. The key is this pattern off of the low. No compromising, it has to be this exactly.
1. Deep red M5 candle on the low of the day
2. That candle reverses at the last second to form a bullish hammer.
3. If that deep red candle closes on its low and the next M5 candle is a bullish engulf that is also fine.
4. The immediate candles off of that low are LONG green candles stacked. At least 5 of them and they reverse the losses on M30 chart. Very little to no overlap, no dojis. Monster volume. No looking back off of that low. Pauses are fine, but after 15 minutes we get the next leg higher.
We did NOT bet this pattern Friday and I mentioned that. This is the OMG air pocket we need to find that support.
Support is at $429. Resistance is at 200-day MA
.
.

Daily Bulletin Continues...