Big Market Drop – Stay Calm – Here’s the Game Plan
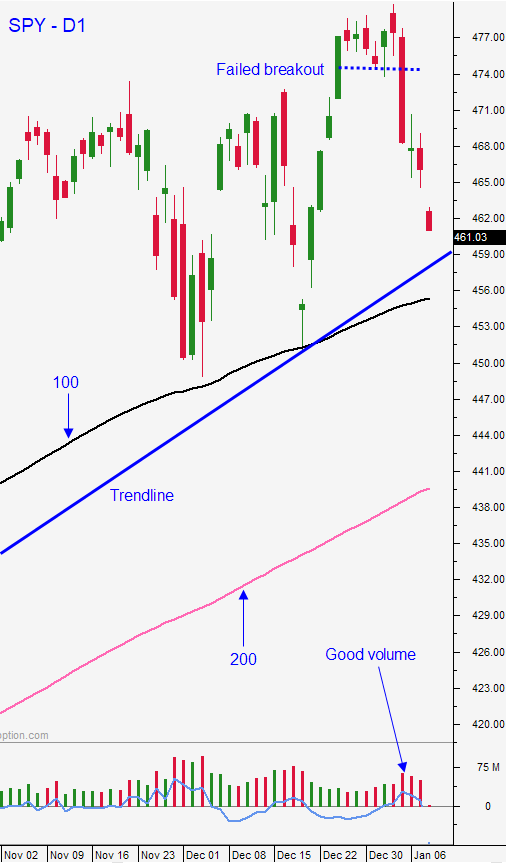
Posted 9:30 AM ET – In the last few months I have pointed out how the character of the market is changing. We are visiting the 100-day MA with greater frequency and the dips are lasting longer. This is a sign that the bull market is getting tired. This morning the S&P 500 is down 50 points overnight and we are going to probe for support into earnings season.
TLT (20-Year US Treasuries) is testing $141 and that is a major technical support level. If it fails it will put downward pressure on tech stocks and the market. Most Fed officials did not expect a rate hike in 2022, and now most of them are predicting four rate hikes this year. That is a very hawkish swing in a very short time span.
Inflation is spiking and we have seen “hot” CPI/PPI readings. Hourly wages are also increasing (.6% in last jobs report) and that is the highest input cost for companies. With the Fed’s current policy real yields (interest rate less inflation) continue to fall further into negative territory. Asset Managers are selling bonds and they (not the Fed) are the ultimate pricing mechanism.
In the last 6 months, China has been on the radar. If it is the global growth engine, why is their stock market in bear territory (> 20% off of the high)? China’s GDP grew 4% and that was much lower than expected. Retail sales which typically show growth around 8-10% came in at a meager 1.7% in December (Y/Y). The PBOC cut interest rates 10 basis points for the first time since the pandemic peak in 2020. They see the warning signs.
Swing traders do not have to hit the panic button. You should have OTM bullish put spreads on early last week and you should have avoided the tech sector for the reasons mentioned above. Your bullish put spreads should be below technical support. Watch those stocks and look for relative strength. Does that mean your stocks will not go down? No. It means that relative to the market, they are holding up well. You want that to continue. If that is the case, maintain the positions and use those longer term support levels for your stops. If you have a basket of these positions on you can add some overnight protection using SPY puts or /ES if the SPY closes below the 100day MA (unlikely). I would not go overboard with this hedge since I still expect the 100-day MA to hold into earnings season. Remember the stock just has to hold that support for the trade to work out. Time decay will start kicking in. I would not be adding to positions since I believe the FOMC meeting next week could create selling pressure.
“Pete I am so very afraid. Why are you so confident support will hold?” I will answer that question with a question. First of all, if you are afraid, don’t sell OTM bullish put spreads. What are Asset Managers going to invest in? Bonds are going down and generating negative real returns. I don’t believe they are going to rush into bonds given that back drop. Know that corporations are issuing cheap debt and using the proceeds to buy back shares (they are buyers). AAPL has retired 25% of its shares outstanding in the last 5 years. More money chasing fewer shares is why these valuations are so high. Credit concerns are the only thing that can spark sustained selling. I am seeing some cracks in the dam longer term, but nothing that will manifest in the next few weeks.
Day traders this will be a nasty down open. I won’t chase a gap and go drop with stacked red candles, but that pattern would suggest a bearish trend day (20%). Any bounce would be an opportunity to short and we could test the 100-day MA if this happens. Stacked green candles on the open that retrace to $463 would tell me that buyers are still engaged. We may see choppy trading, but a blood bath will be avoided (20%). One of the most likely scenarios is a choppy but steady drift lower with long red candles and small green candles on the retracements. This pattern is resolved with a series of long red candles through the low end of the trading channel (M5) and a bullish engulf or bullish hammer (30%). That low would take 3 hours to form and it would be a good opportunity for long only traders (be patient). The other pattern is mixed horizontal candles (30%). This would confirm support. The longer the low of the day holds, the more likely we are to bounce and I would favor the long side if I see this. There is incredible sector rotation. Make sure you are leaning on this regardless of which side you pick. I am trading normal size. There will be good movement today.
Do you recognize my day trading comments? I did not change a word from Friday and if you followed this advice you did well.
Support is 100-day MA. Resistance is at 50-day MA
.
.

Daily Bulletin Continues...