Market At A Critical Juncture – Make Sure Support Holds Then Use This Options Trading Strategy
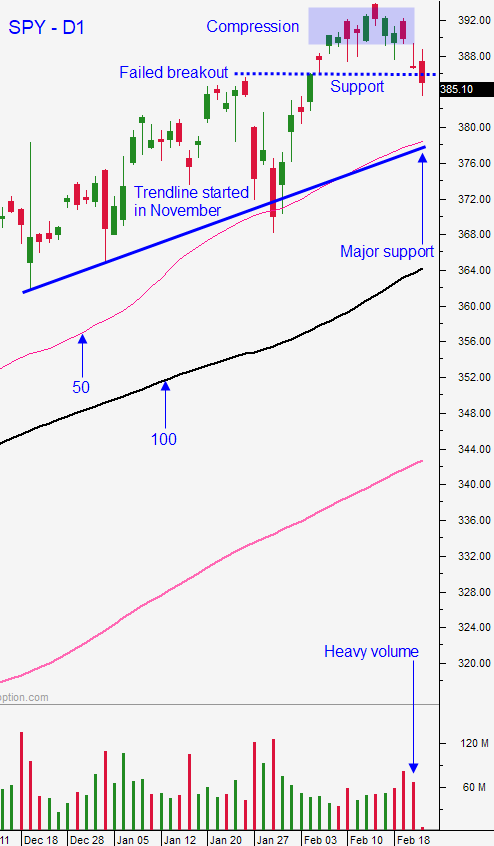
Posted 9:30 AM ET - It's exciting to turn your screen on Monday morning and to see the S&P 500 up 40 points. Unfortunately, we are just recovering the losses from the last 10 minutes of trading on Friday. The market remains volatile and traders are digesting the impact that a massive stimulus bill will have on inflation and economic growth. The Fed remains steadfast in their loose monetary policy and this week we will get employment data. It's critically important that the S&P 500 closes above the 50-day moving average this week.
Traders need to closely monitor the US Treasury 10-year Note (TLT). I believe that we are seeing a selling climax in bonds and that it will bounce for at least a month or two. If interest rates start to ease the market will rally.
More is not always better and a smaller stimulus bill might put investors at ease. There's some question regarding the economic impact of a large stimulus bill and the market wants to make sure that we are getting our "bang for the buck". Our national debt in the US is at levels not seen since World War II (as a percentage of GDP).
New Coronavirus cases continue to decline and the FDA has approved a new vaccine (single shot) by Johnson & Johnson. Economies are starting to reopen.
Stock valuations are extremely rich, but an economic rebound is just around the corner. Corporate guidance has been raised more than expected and profits will catch up to valuations in the next two quarters. Stocks can bide their time at this level or they can pull back and rebound. In either case, time will pass an stocks will grow into current valuations.
Swing traders should focus on selling out of the money bullish put spreads. This options trading strategy allows us to distance ourselves from the action and to take advantage of accelerated time premium decay. The market has been all over the board in the last few weeks and call buyers have nothing to show for their risk exposure. Time decay has whittled away at those positions and at very best call buyers are at a break even. Call buyers exposed to the tech sector have taken a beating. Focus on cyclical stocks that will benefit from an economic rebound. We are seeing a rotation out of tech and into these sectors. I believe that market volatility will continue and I'm not seeing the level of enthusiasm that I expected on the heels of the stimulus bill. If the SPY closes below the 50-day moving average, stop selling out of the money bullish put spreads and manage your open positions. I don't believe that we will see a big market breakdown, but if the 50-Day MA does not hold, we are likely to test the 100-day moving average. In that case you will have to monitor relative strength and technical support for each of the stocks that you sold bullish put spreads on. If the market breaks critical support and stocks break technical support, buy the short put back and let the long put run. I typically like to set my profit for the long put equal to the price that I paid to repurchase the short put. I don't believe we are going to see a market breakdown, but this is how I would respond if it happens. The most likely scenario is that this market dip will find support and that we will chop around in a fairly wide range while bonds bounce.
Day traders should watch for early weakness. Gaps higher have been an excellent fade recently. We need to make sure that the market bid is strong before we buy. Relative strength will be harder to spot this morning because “all ships rise with the tide”. If the market does retrace we will be able to find the strongest stocks. The TLT has pulled back from its close Friday and I believe that the opening rally is vulnerable. Beginning of the month fund buying will lend some support today. Tread cautiously at this critical SPY support level and wait for technical confirmation. The market has been volatile and it could go either way. Stay fluid and use the 1OP indicator is your guide.
Support is at the 50-day moving average and resistance is at $386.40 and $392.
.
.

Daily Bulletin Continues...