Masters level statistics, finance, and economics courses have not influenced my trading nearly as much as treating it as a game of skill. Gamers need to constantly assess their opponent. I trade like I play chess, and poker, video games, and many sports require this same skill.
Novice chess players only focus on their plan of attack and they are blindsided because they are not paying attention to what their opponent is doing. They are not able to see more than a couple of moves ahead and their game is reactionary instead of anticipatory.
In chess, you have to constantly evaluate the board. If I make this move, the opponent is likely to respond with this. If they respond with this, then I will counter with this. The deeper your vision, the more successful you will be in chess. This is also true in trading. I am constantly planning ahead and I watch my opponent’s (the S&P 500) every move.
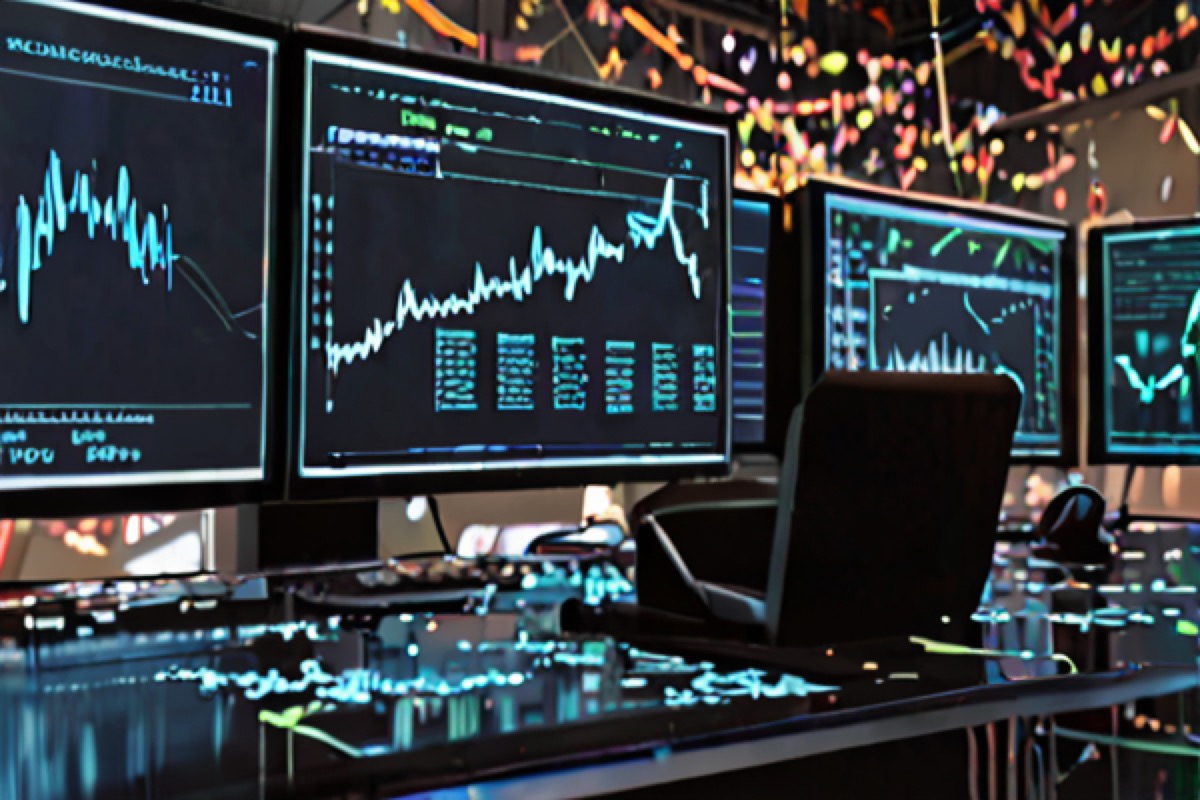
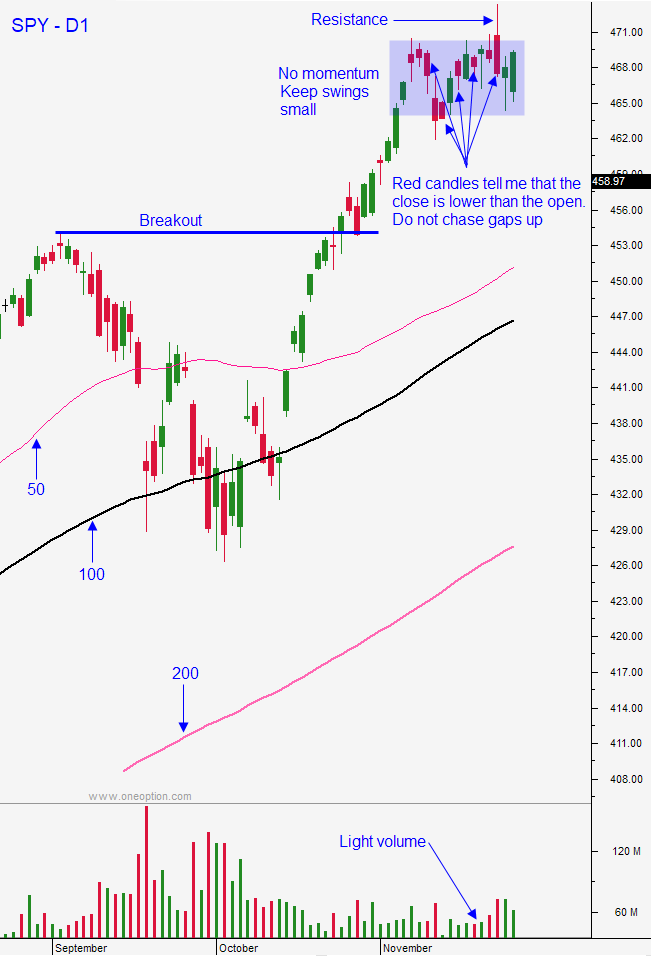
Before I start the day I evaluate the overnight news, domestic and international. Sometimes there are material news events and other times there are not. The key is not to get blindsided by your opponent: the market. I analyze overseas market moves to see if they are providing a springboard or a market drag. I look at bond charts to gauge interest rates. Then I conduct technical analysis on a daily chart. What is the current momentum? Is there a strong trend? Is the volume heavy or light? What do the daily candles tell me? If the candles are compressed it tells me that I should not expect big intraday ranges. If the market is trending higher it tells me I should favor the long side. If the candles are red it tells me the closes are lower than the open and that I do not have to chase gaps higher.
In the chart below my conclusion is that the longer-term trend is higher and I should favor the long side. The market is currently compressing so the momentum has waned. The candle from two days ago reversed sharply forming a bearish hammer. That tells me that there is resistance at the all-time high. The bodies of the candles are fairly small and the volume is fairly light so I should not expect a big intraday move. The red candles tell me not to chase opening gaps higher because the close is lower than the open and if I am patient I will have a better entry point for my trades. Notice I have not even started considering the market move today, let alone zeroing in on a stock.
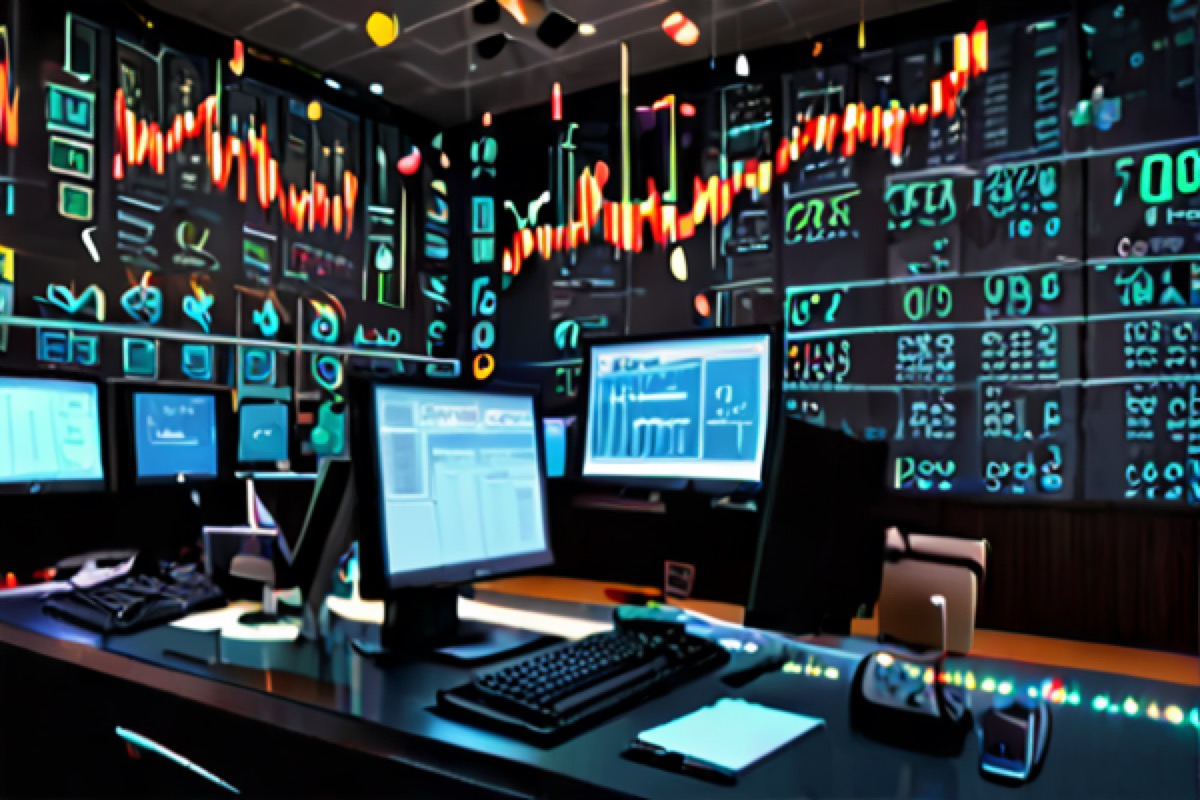
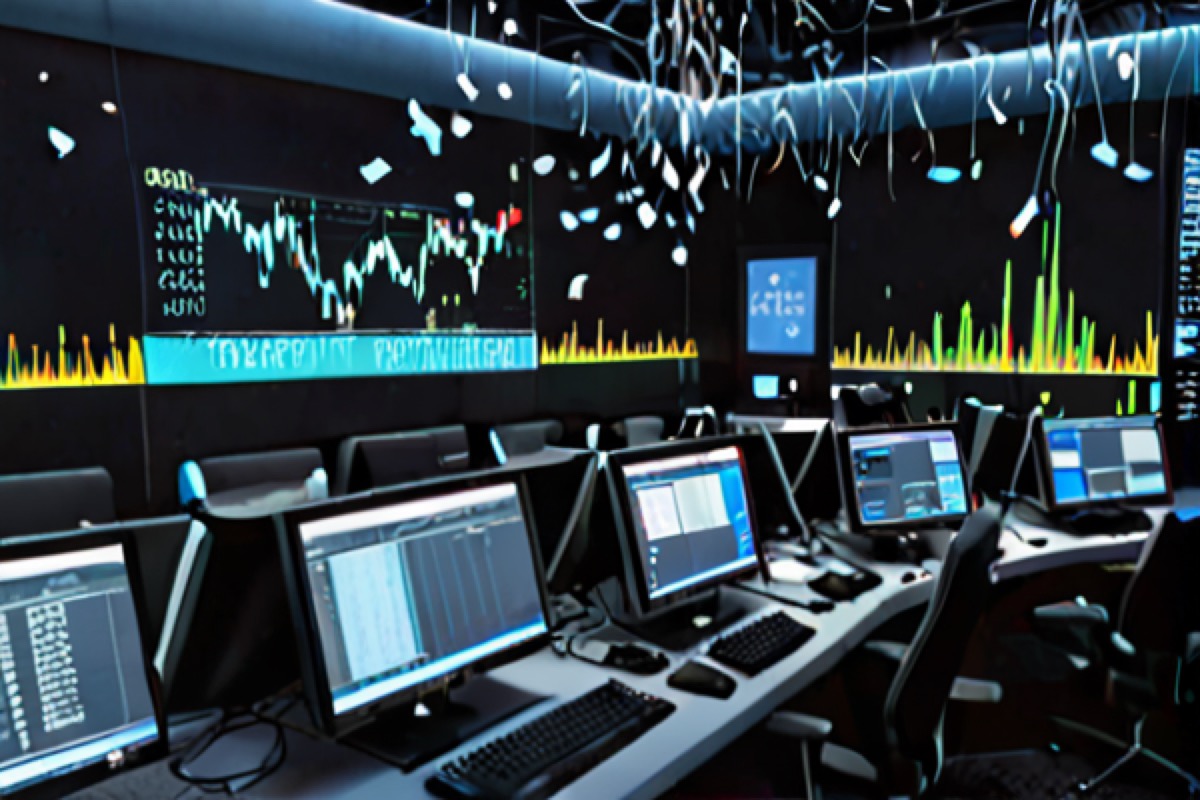
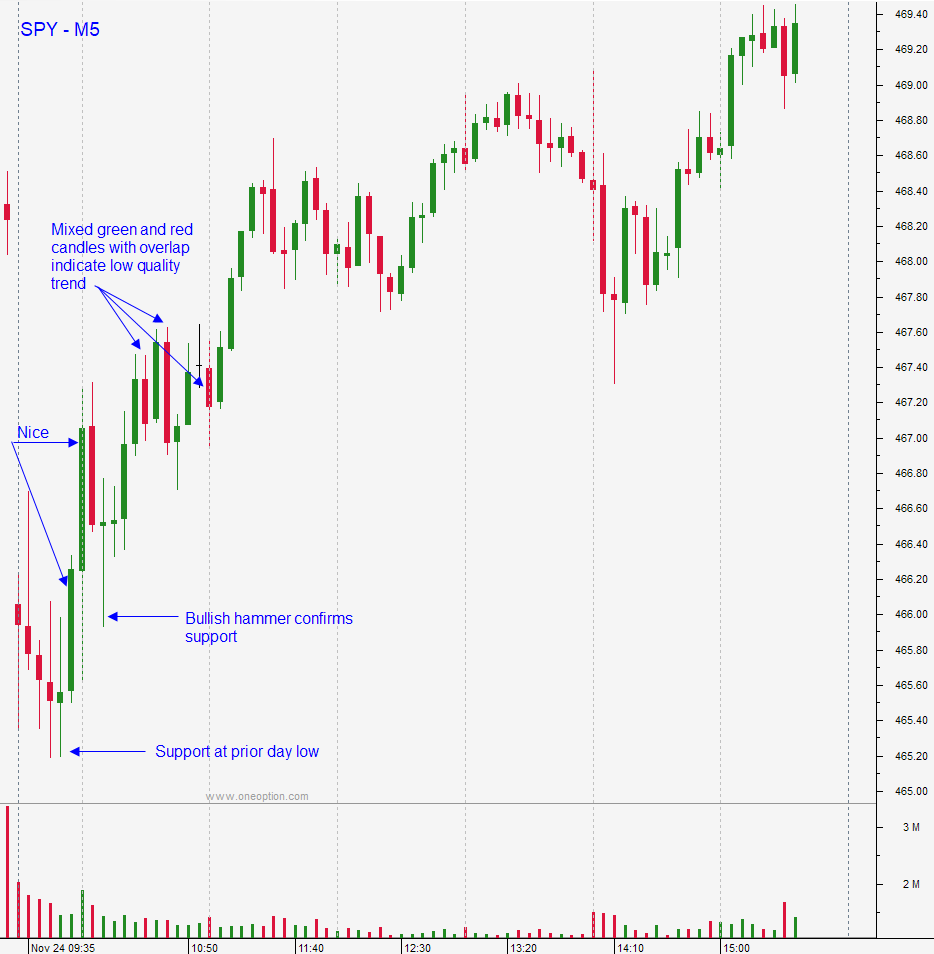
When I start looking at current market conditions I am trying to put the current move into the longer term context. Is this an inside day? Has the market been able to stack candles in either direction? What is the volume like? Are there any longer-term moving averages or trend lines (horizontal or diagonal) that come into play on the intraday chart?
In the chart below I can see long tails and a mix of green and red candles. The volume is light and we are in pre-holiday mode. The market is inside of the prior day’s range so I should not expect big directional moves. The stacked long green candles after the test of the prior low followed by the bullish hammer tell me that there is support at the low of the day. The mixed green and red candles are overlapping and that is a sign that the trend strength is weak. If I take a position in a strong stock I should set passive targets. I might not have to worry about the market rug getting pulled out from under me, but I should not expect much of a market tailwind. That means the stock will need to do all of the heavy lifting.
The market drives your trading decisions. It tells you if you should be long or short and how passive or aggressive you should be. View the market as your opponent and apply your gaming skills. You have a new opponent every day. Analyze and adapt.
Trade well.